
Understanding Feerate Dynamics
The market changes often, and it gets difficult to keep up with everything that’s happening on-chain.
Real-time data helps us see what’s currently happening, while historical data can be used to observe the frequency and magnitude of the spikes.
Unfortunately, there is no one-size-fits-all data platform that covers research from start to finish. Instead, we’ve compiled a list of tools to get you started:
- Raw data -> To understand where feerate is at, or was
- On-chain activities -> To understand why feerate is spiking, or spiked
Let’s take a look at what these tools are and what kind of data you can derive from them.
An open-source project for the Bitcoin community, mempool.space focuses on the transaction fee market. Here, you can get real-time updates of a current Bitcoin block being filled, refer to past blocks’ feerates, or even have a predicted view of future blocks.
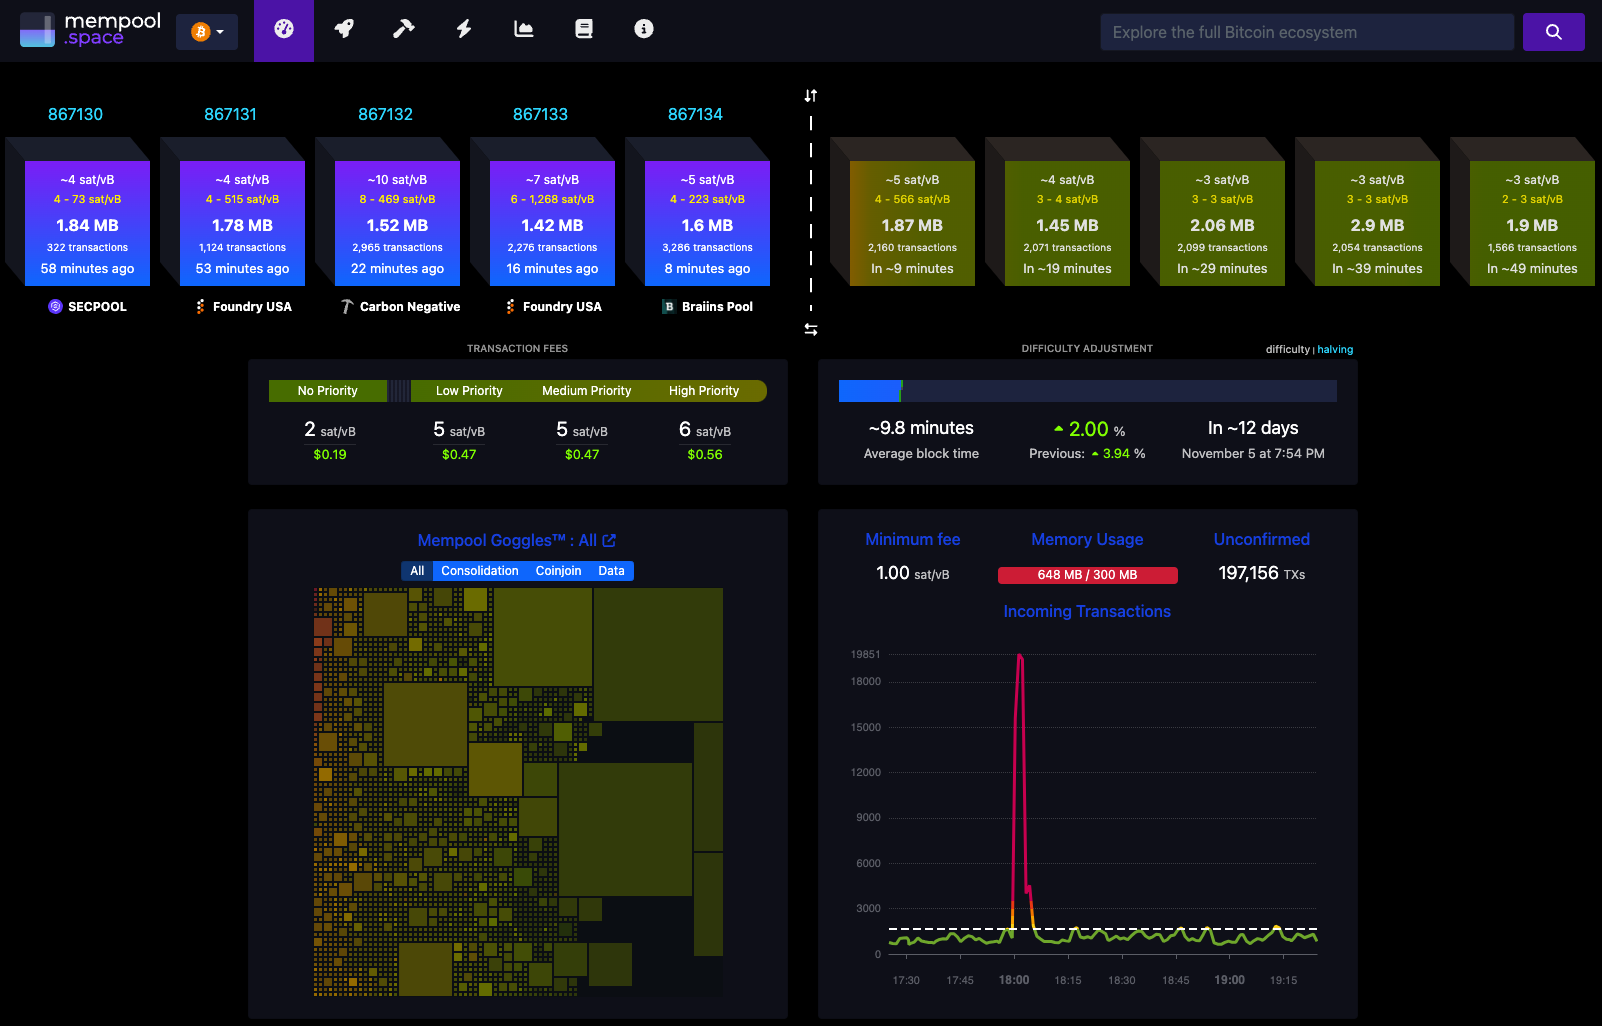
Mempool.space Dashboard
Their graphs are a great tool if you are looking for something simple. Learning from history is one of the best ways to understand the market and its trends.
Remember, Alkimiya uses the average of median feerates across a single pool. When looking at external data sources, make sure you are using the correct graph.
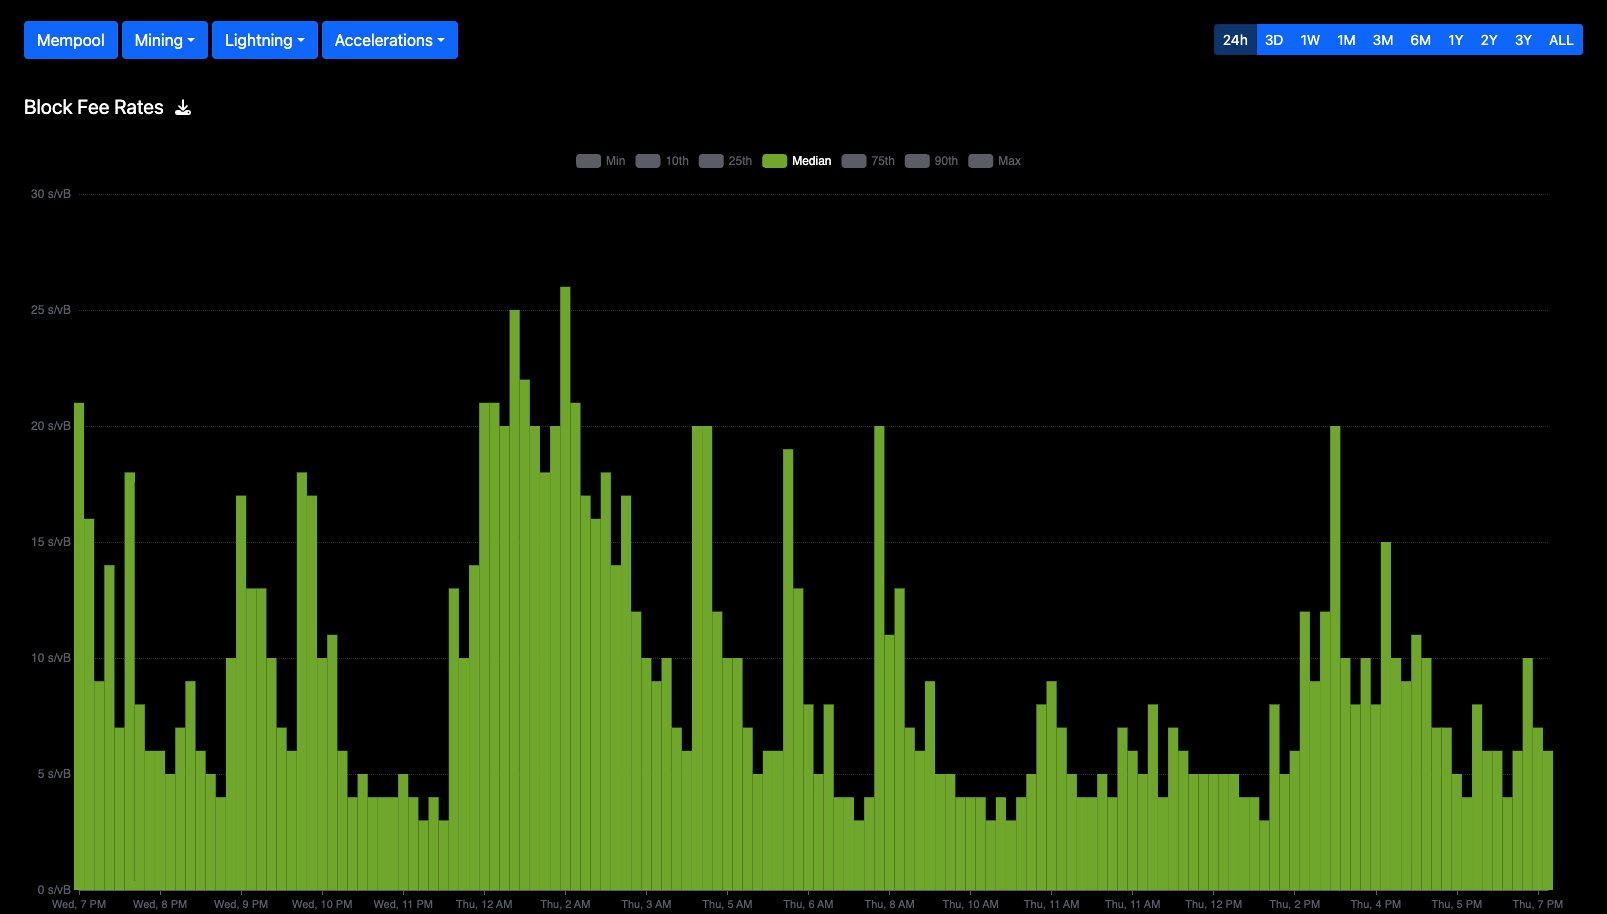
Mempool.space Graphs
Dune Analytics is a data platform used to analyze on-chain data from various blockchain networks, gain insights into blockchain transactions, smart-contract interactions, and more.
If you’re just starting out, take some time to explore Alkimiya’s Official Dune Dashboard .
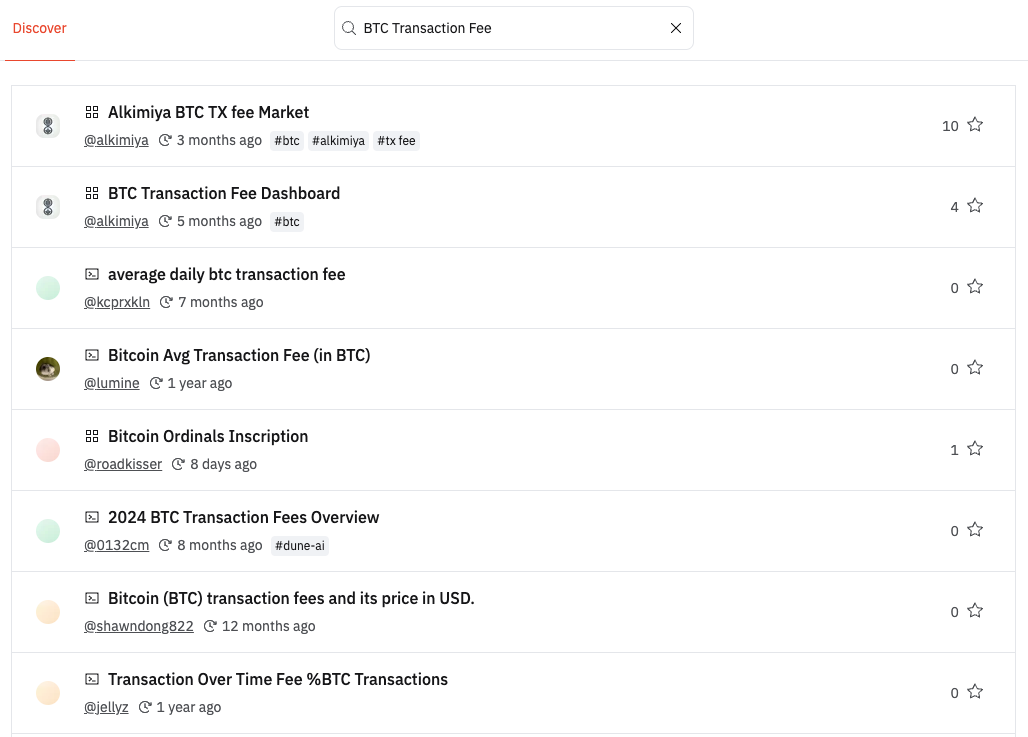
Dune Analytics
Mempool.space and Dune are excellent resources to pull raw data and observe historical trends. But what exactly caused the feerate to spike? We have to connect data with actual events to reveal the full picture.
GeniiData - The All Around Trader
This is an incredible platform that has a ton of data on Runes, Ordinals, and BRC-20. It is an all-in-one tool that focuses on on-chain activities across platforms like Magic Eden, OKX, Xverse, and more.
GeniiMap
GeniiMap is a collection of treemaps that shows the count of active minters within the past 24-hour period. Simple, intuitive, and all at a glance.
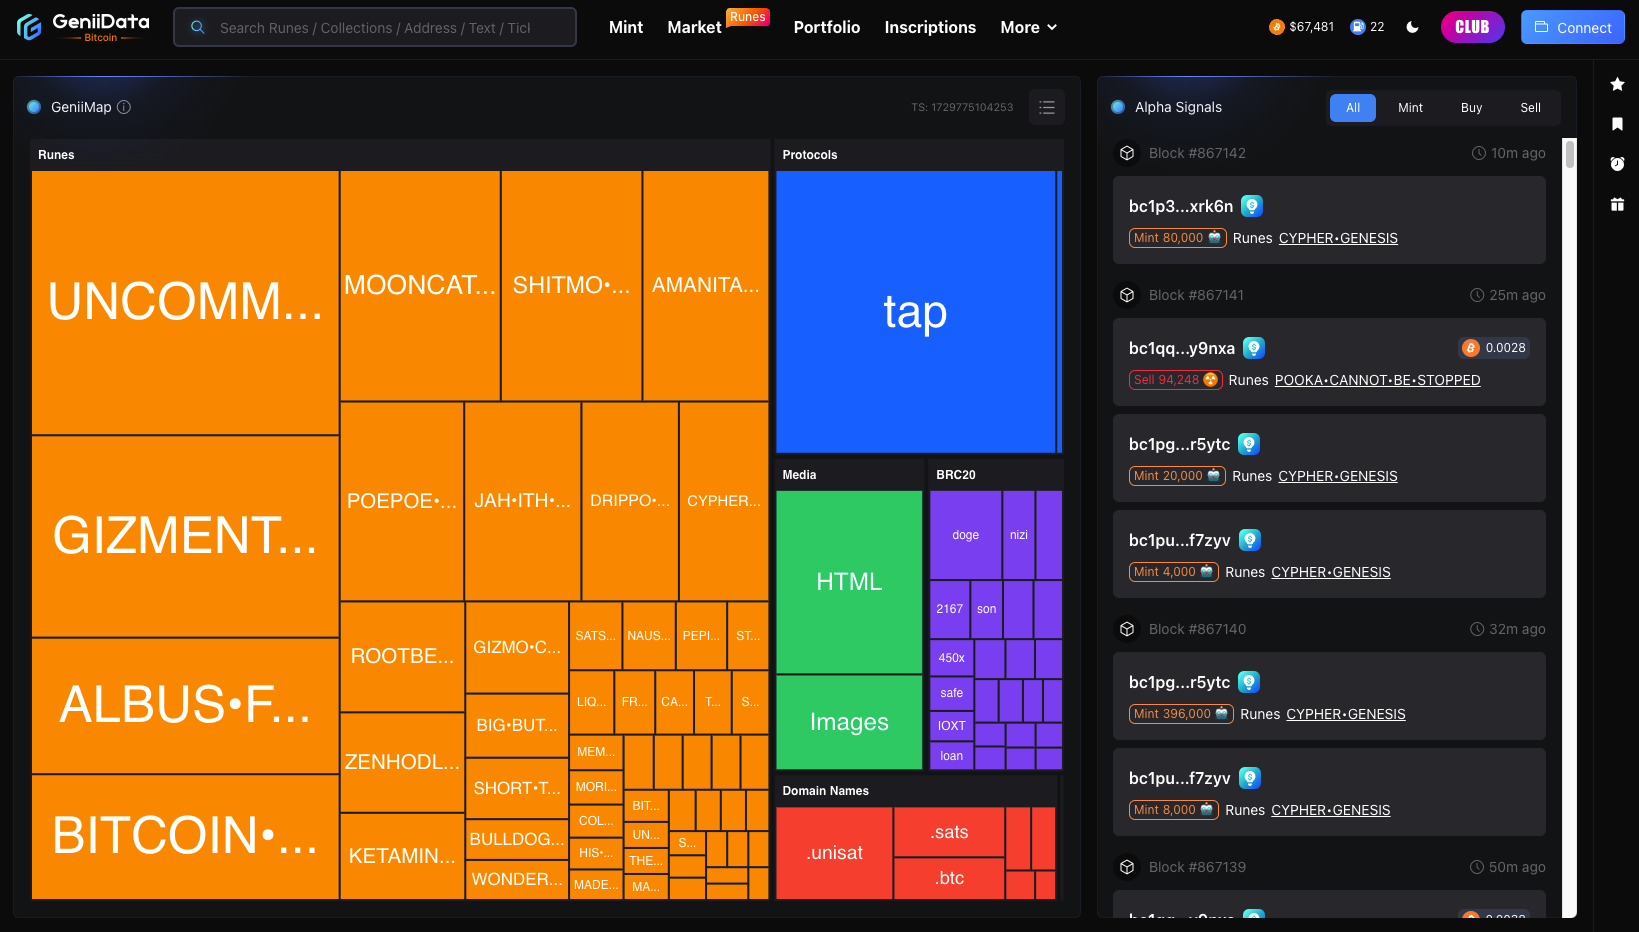
GeniiData GeniiMap
GeniiData Market
Metrics like 24H Volume and 24H Sales are most relevant to feerate movement.
24H Volume is indicative of the ticker’s liquidity level - the higher the volume, the higher the market interest, the higher the possibility of more future transactions.
24H Sales is indicative if the frequency at which a ticker is traded - the higher the sales, the higher the number of transactions, the higher the possibility of more future transactions.
NoteIt is possible for a Rune to have low 24H Volume and high 24H Sales. They are not standalone metrics.
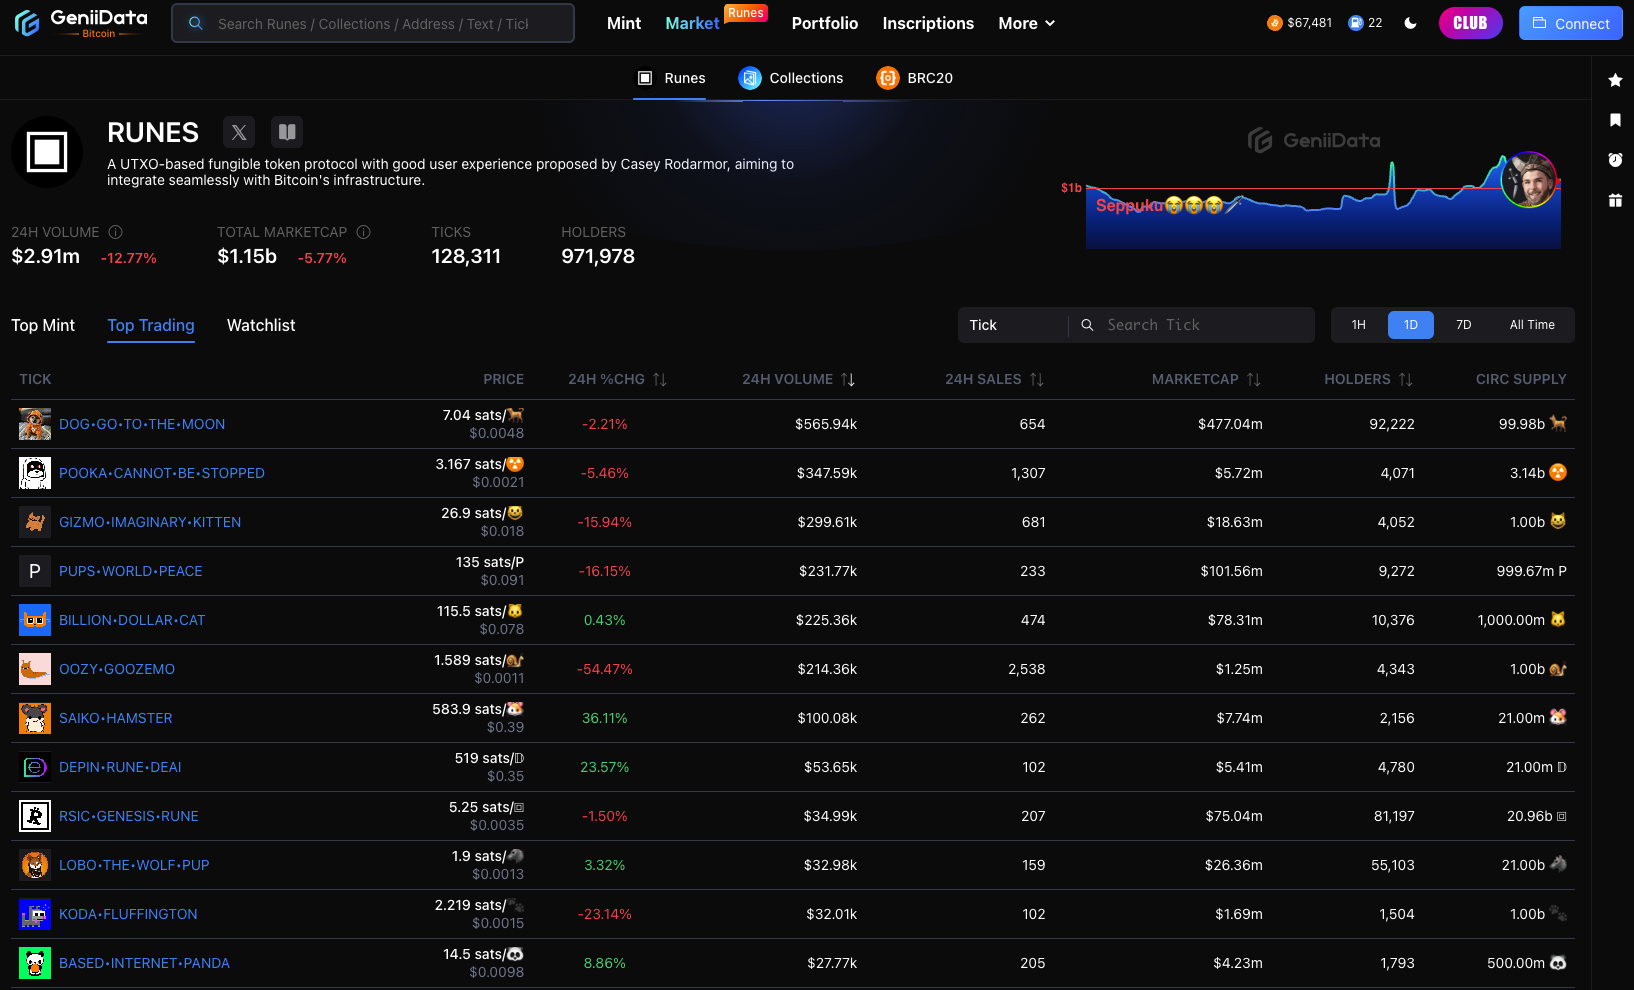
GeniiData Market
Satosea - The Chronically Online Minter
This is a fantastic tool to visualize real-time Rune-specific activities, with a heavy focus on feerate..
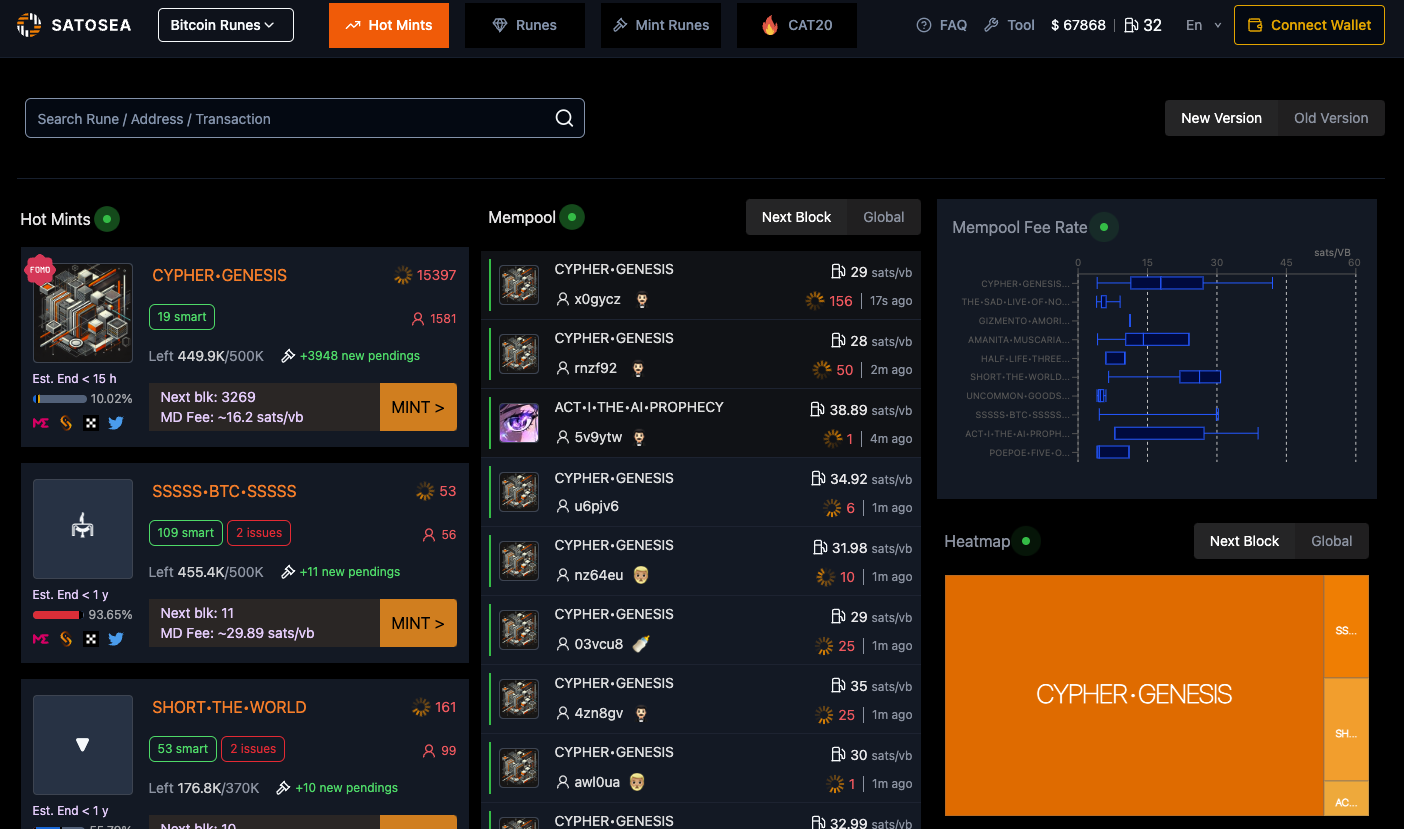
Satosea
As a Rune is minting, median feerate, pending mints, feerate per transaction, and many other details are available
If you’re currently learning to navigate data and happen to chance upon a mint occurring, make sure to refer to Mempool.space as mentioned above. Compare the data from Satosea and mempool.space to familiarize yourself with on-chain activities and “historical” data as they appear.
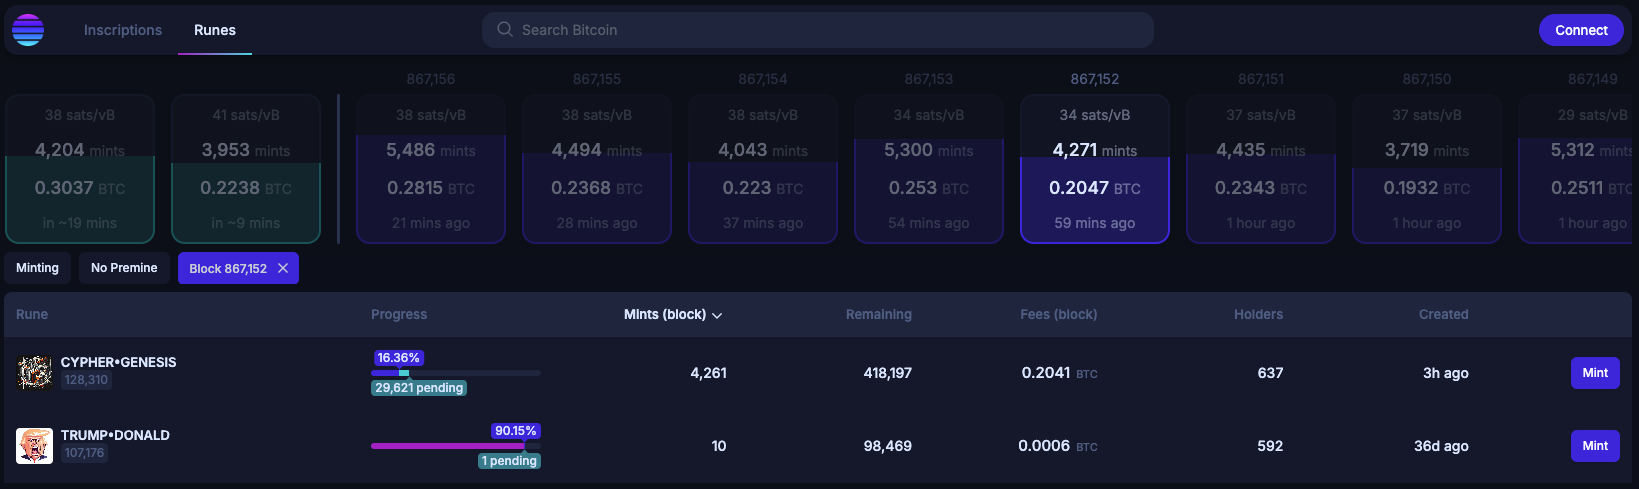
For example, as Rune CYPHER•GENESIS’ mint is happening,
- On Satosea, we see block 867152 with ~35.5 sat/vB
- On mempool.space, we see block 867152 with ~35 sat/vB
Despite the slight discrepancy, the general accuracy is still present.
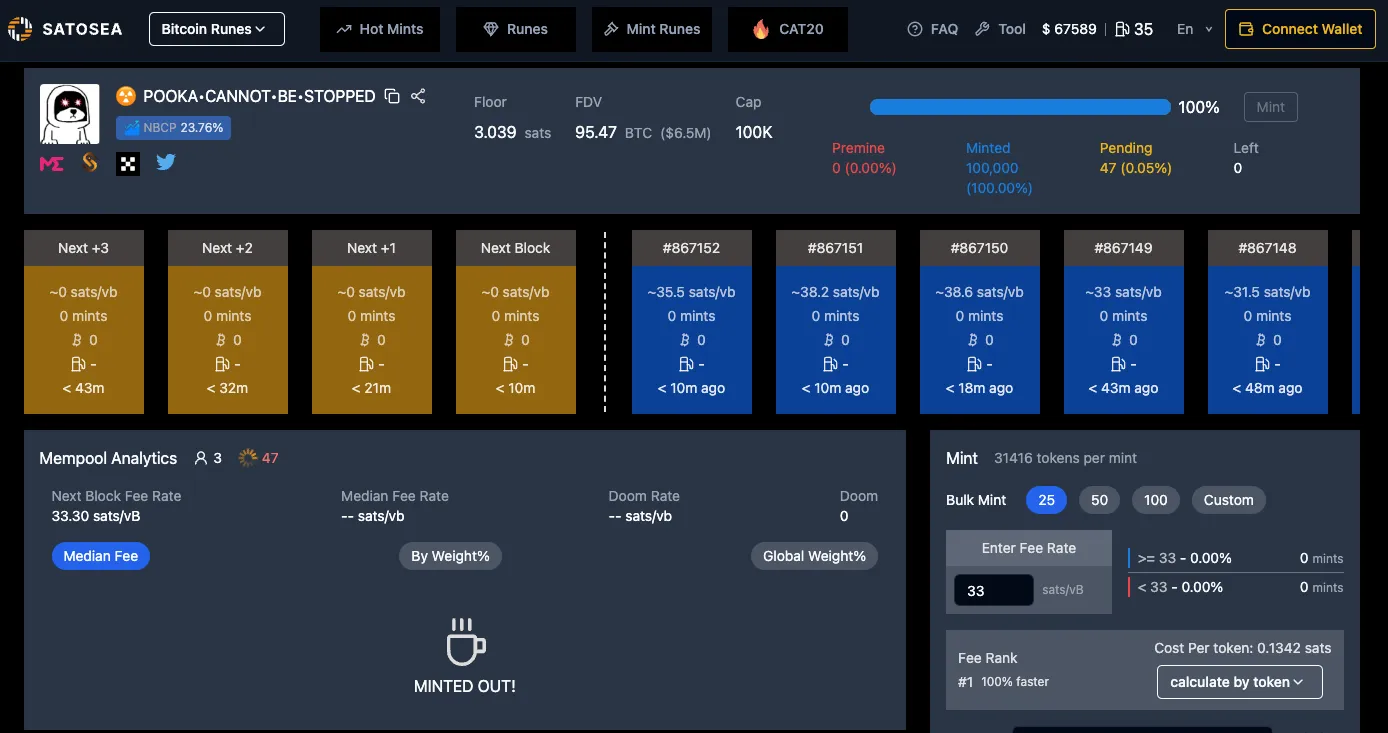
Satosea

Satosea - Rune CYPHER•GENESIS minting
Mempool.Space
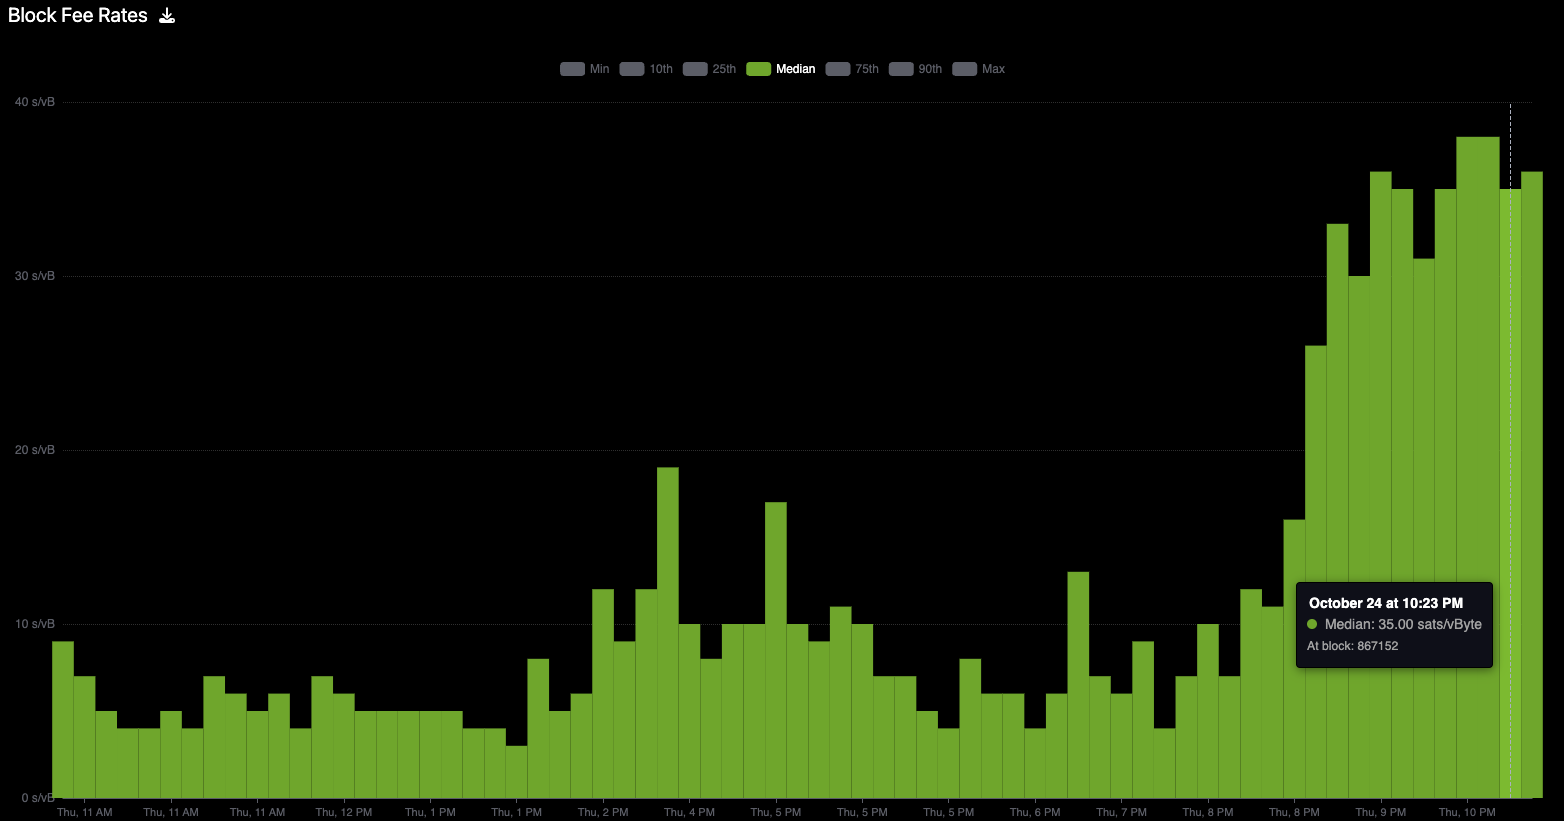
Mempool.space - Rune CYPHER•GENESIS minting
After a Rune is minted out, mostly general data can be found on their specific page. However, there is data on a Rune’s Holds: the cost per mint and the average feerate during its mint.
Rune Minted
Satosea - Rune minted
Rune Minted Holds
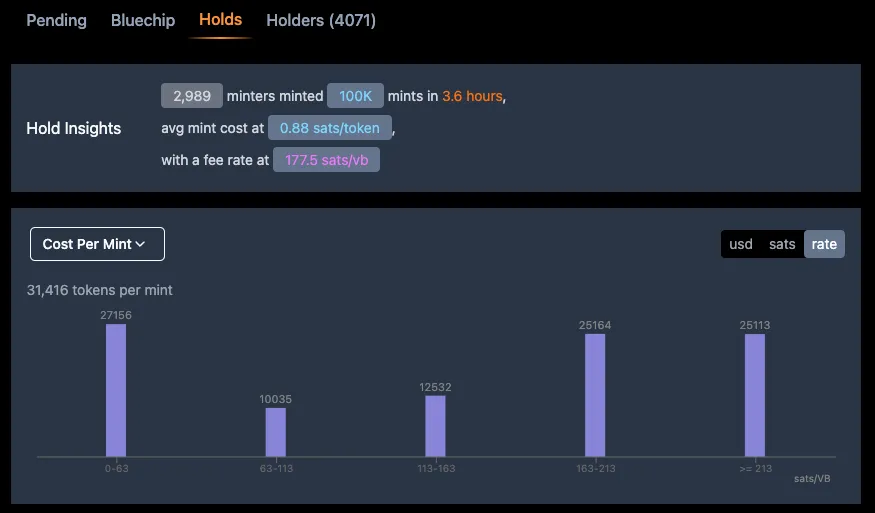
Satosea - Rune minted Holds
Ord.io - The Busy Analyst
If you missed seeing a mint happen live, Ord.io is another straightforward tool to check historical mints.
Ord.ioFor example, we check mempool.space and discover that the median feerate in block 867152 (same block mentioned in the Satosea section) increased out of nowhere. What’s going on?
We go to Ord.io to find that only two Runes’ mint contributed to the block. Block-specific data like the number of mints, median feerate, and fees spent for CYPHER•GENESIS are available. If the information you find is lackluster, check out the other platforms above to dig deeper.
Ord.io - Block 867152
There are many platforms available to research on-chain activities, but it is important to choose those that best fit your needs.
After learning how to look for data and understand them, it’s time to identify trends 👇🏻
Updated over 1 year ago