
Understanding Revenue Dynamics
The market changes often, and it gets difficult to keep up with everything that’s happening on-chain.
Real-time data helps us see what’s currently happening, while historical data can be used to observe the frequency and magnitude of the spikes.
Unfortunately, there is no one-size-fits-all data platform that covers research from start to finish. Instead, we’ve compiled a list of tools to get you started:
Let’s take a look at what these tools are and what kind of data you can derive from them.
Dune Analytics is a data platform used to analyze onchain data from various blockchain networks, gain insights into blockchain transactions, smart-contract interactions, and more.
If you’re just starting out, take some time to explore Alkimiya’s Official Dune Dashboard.
Focused on the index Total Gas Spent, this dashboard provides a comprehensive analysis of the metrics that drive Base rollup's gas market.
Moving Averages
Since these are based on historical data, they provide a guiding comparison for the current pools’ index.
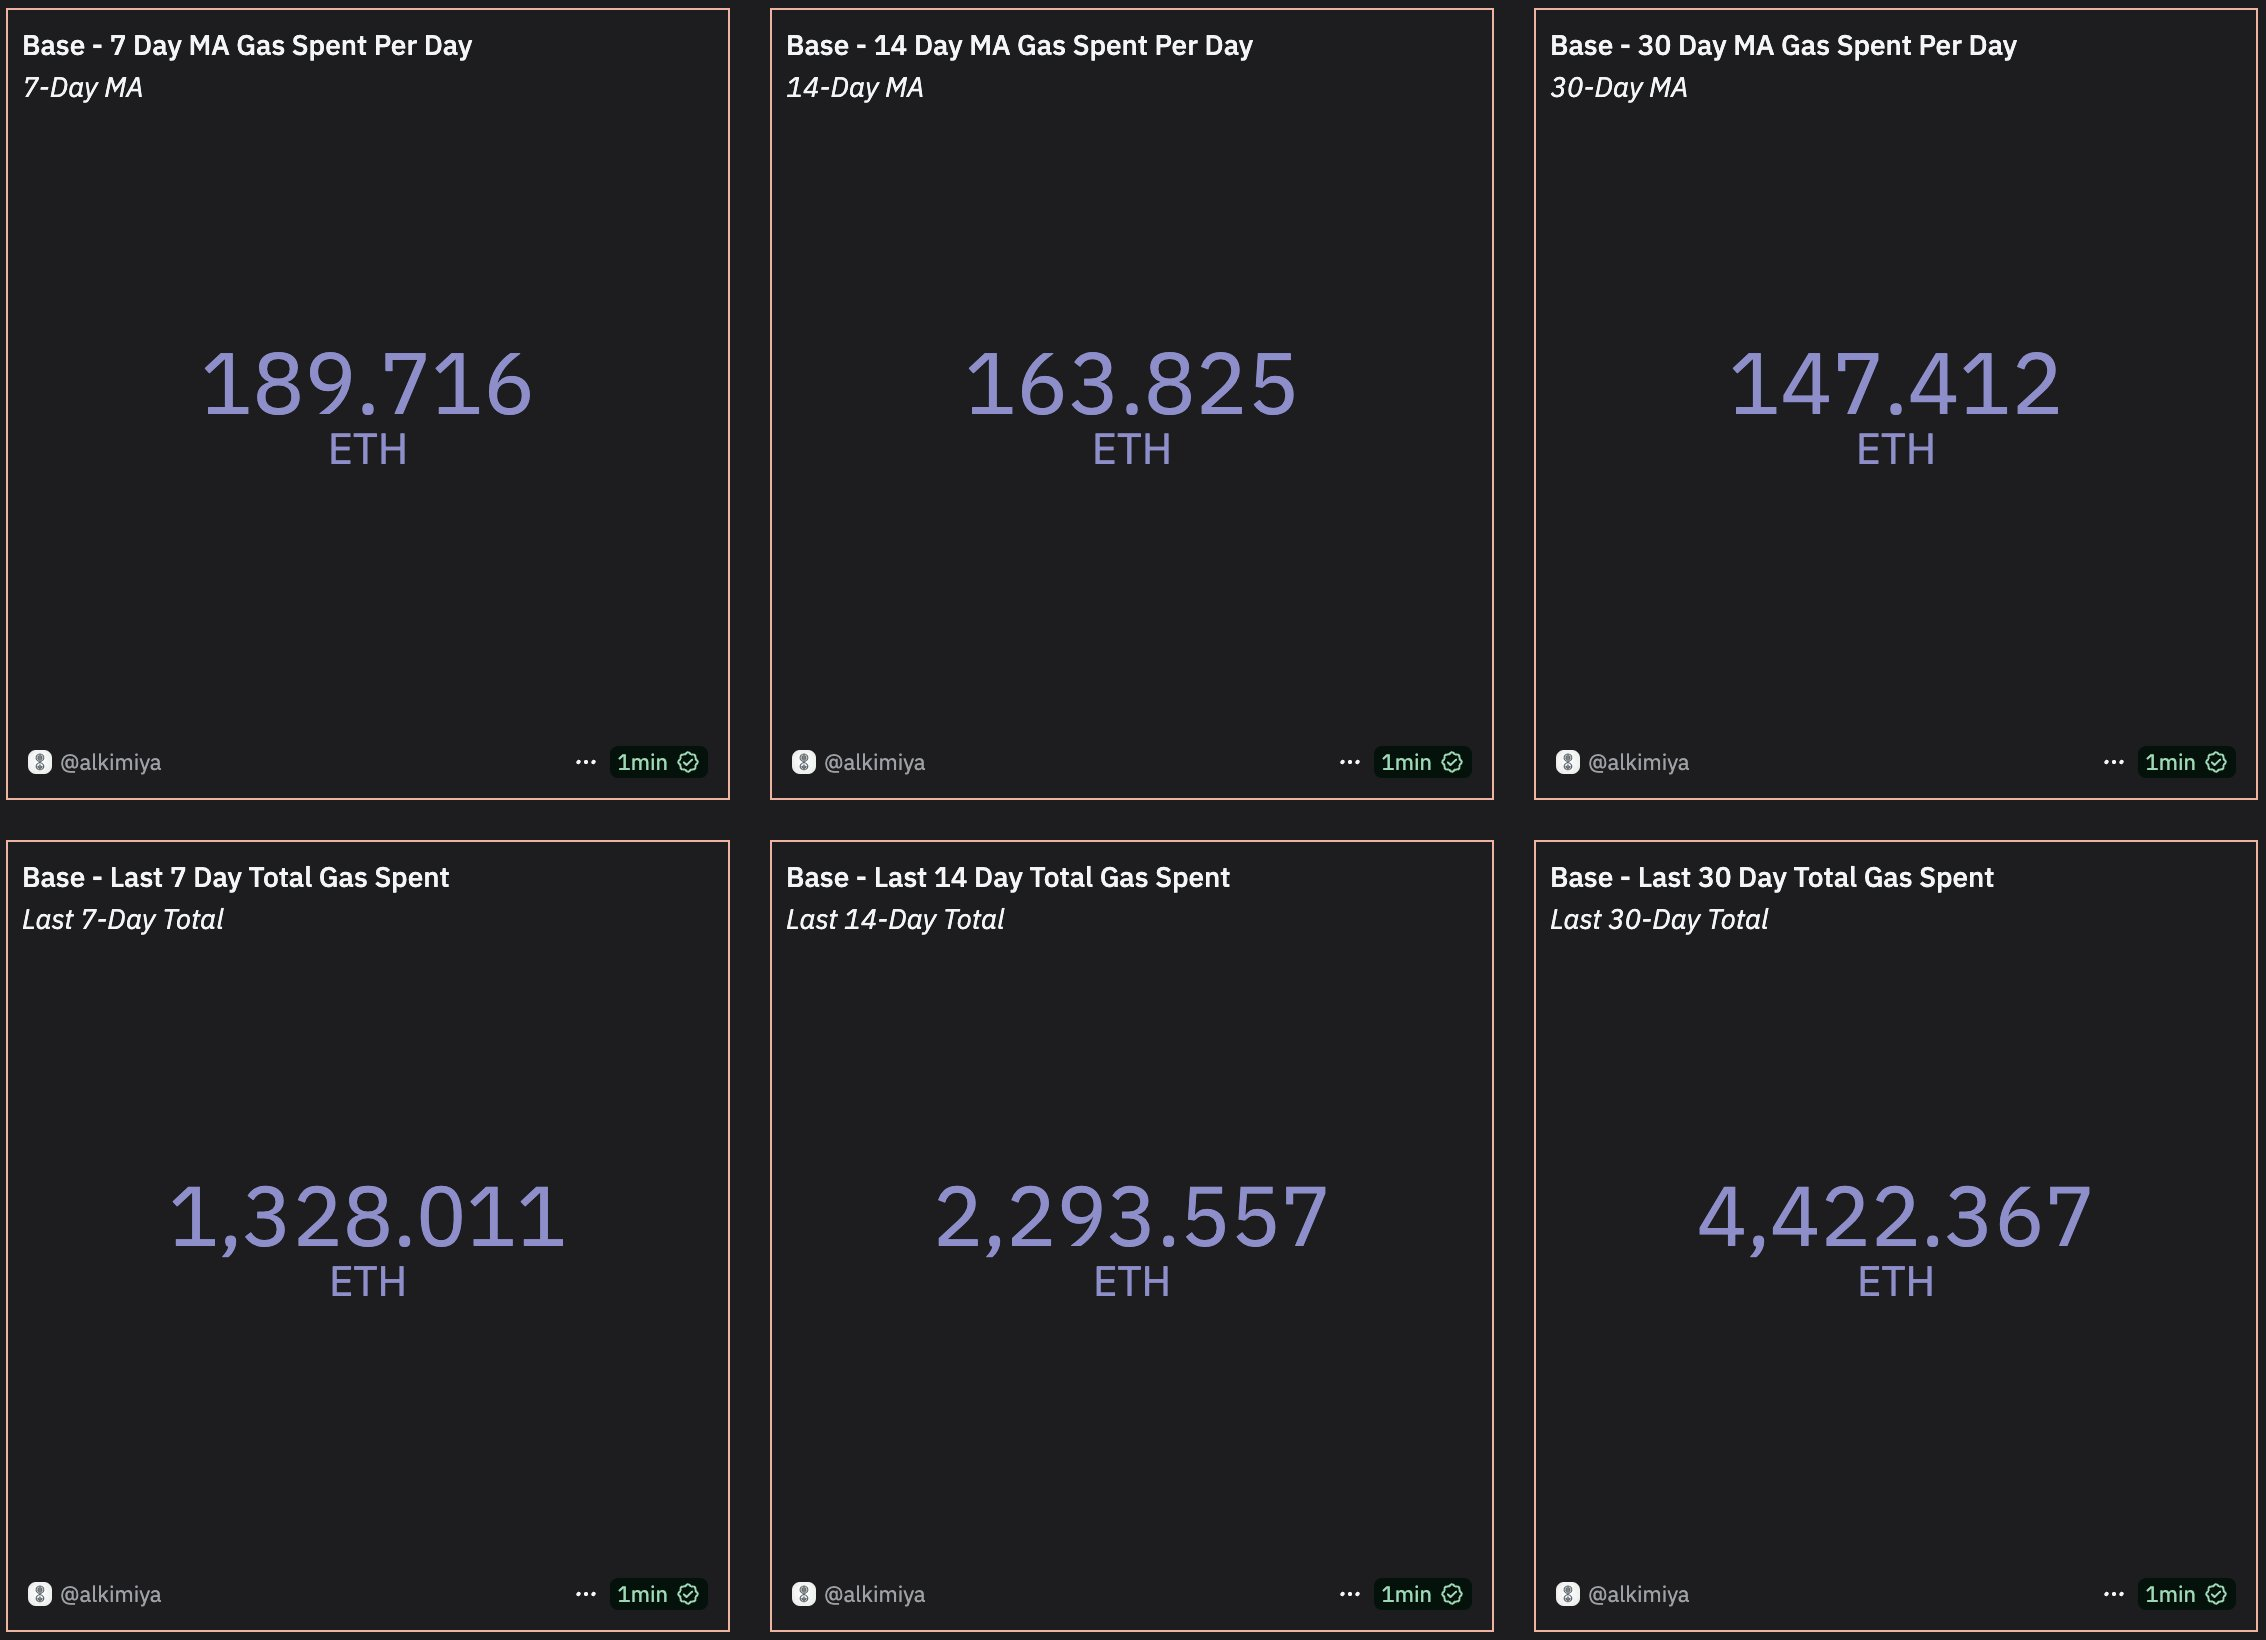
Source: Alkimiya's Base Gas Market, Dune
Transaction Count & Active Users
These are useful indicators of an ecosystem's growth. Generally, the higher these charts go, the larger Base’s growth is.
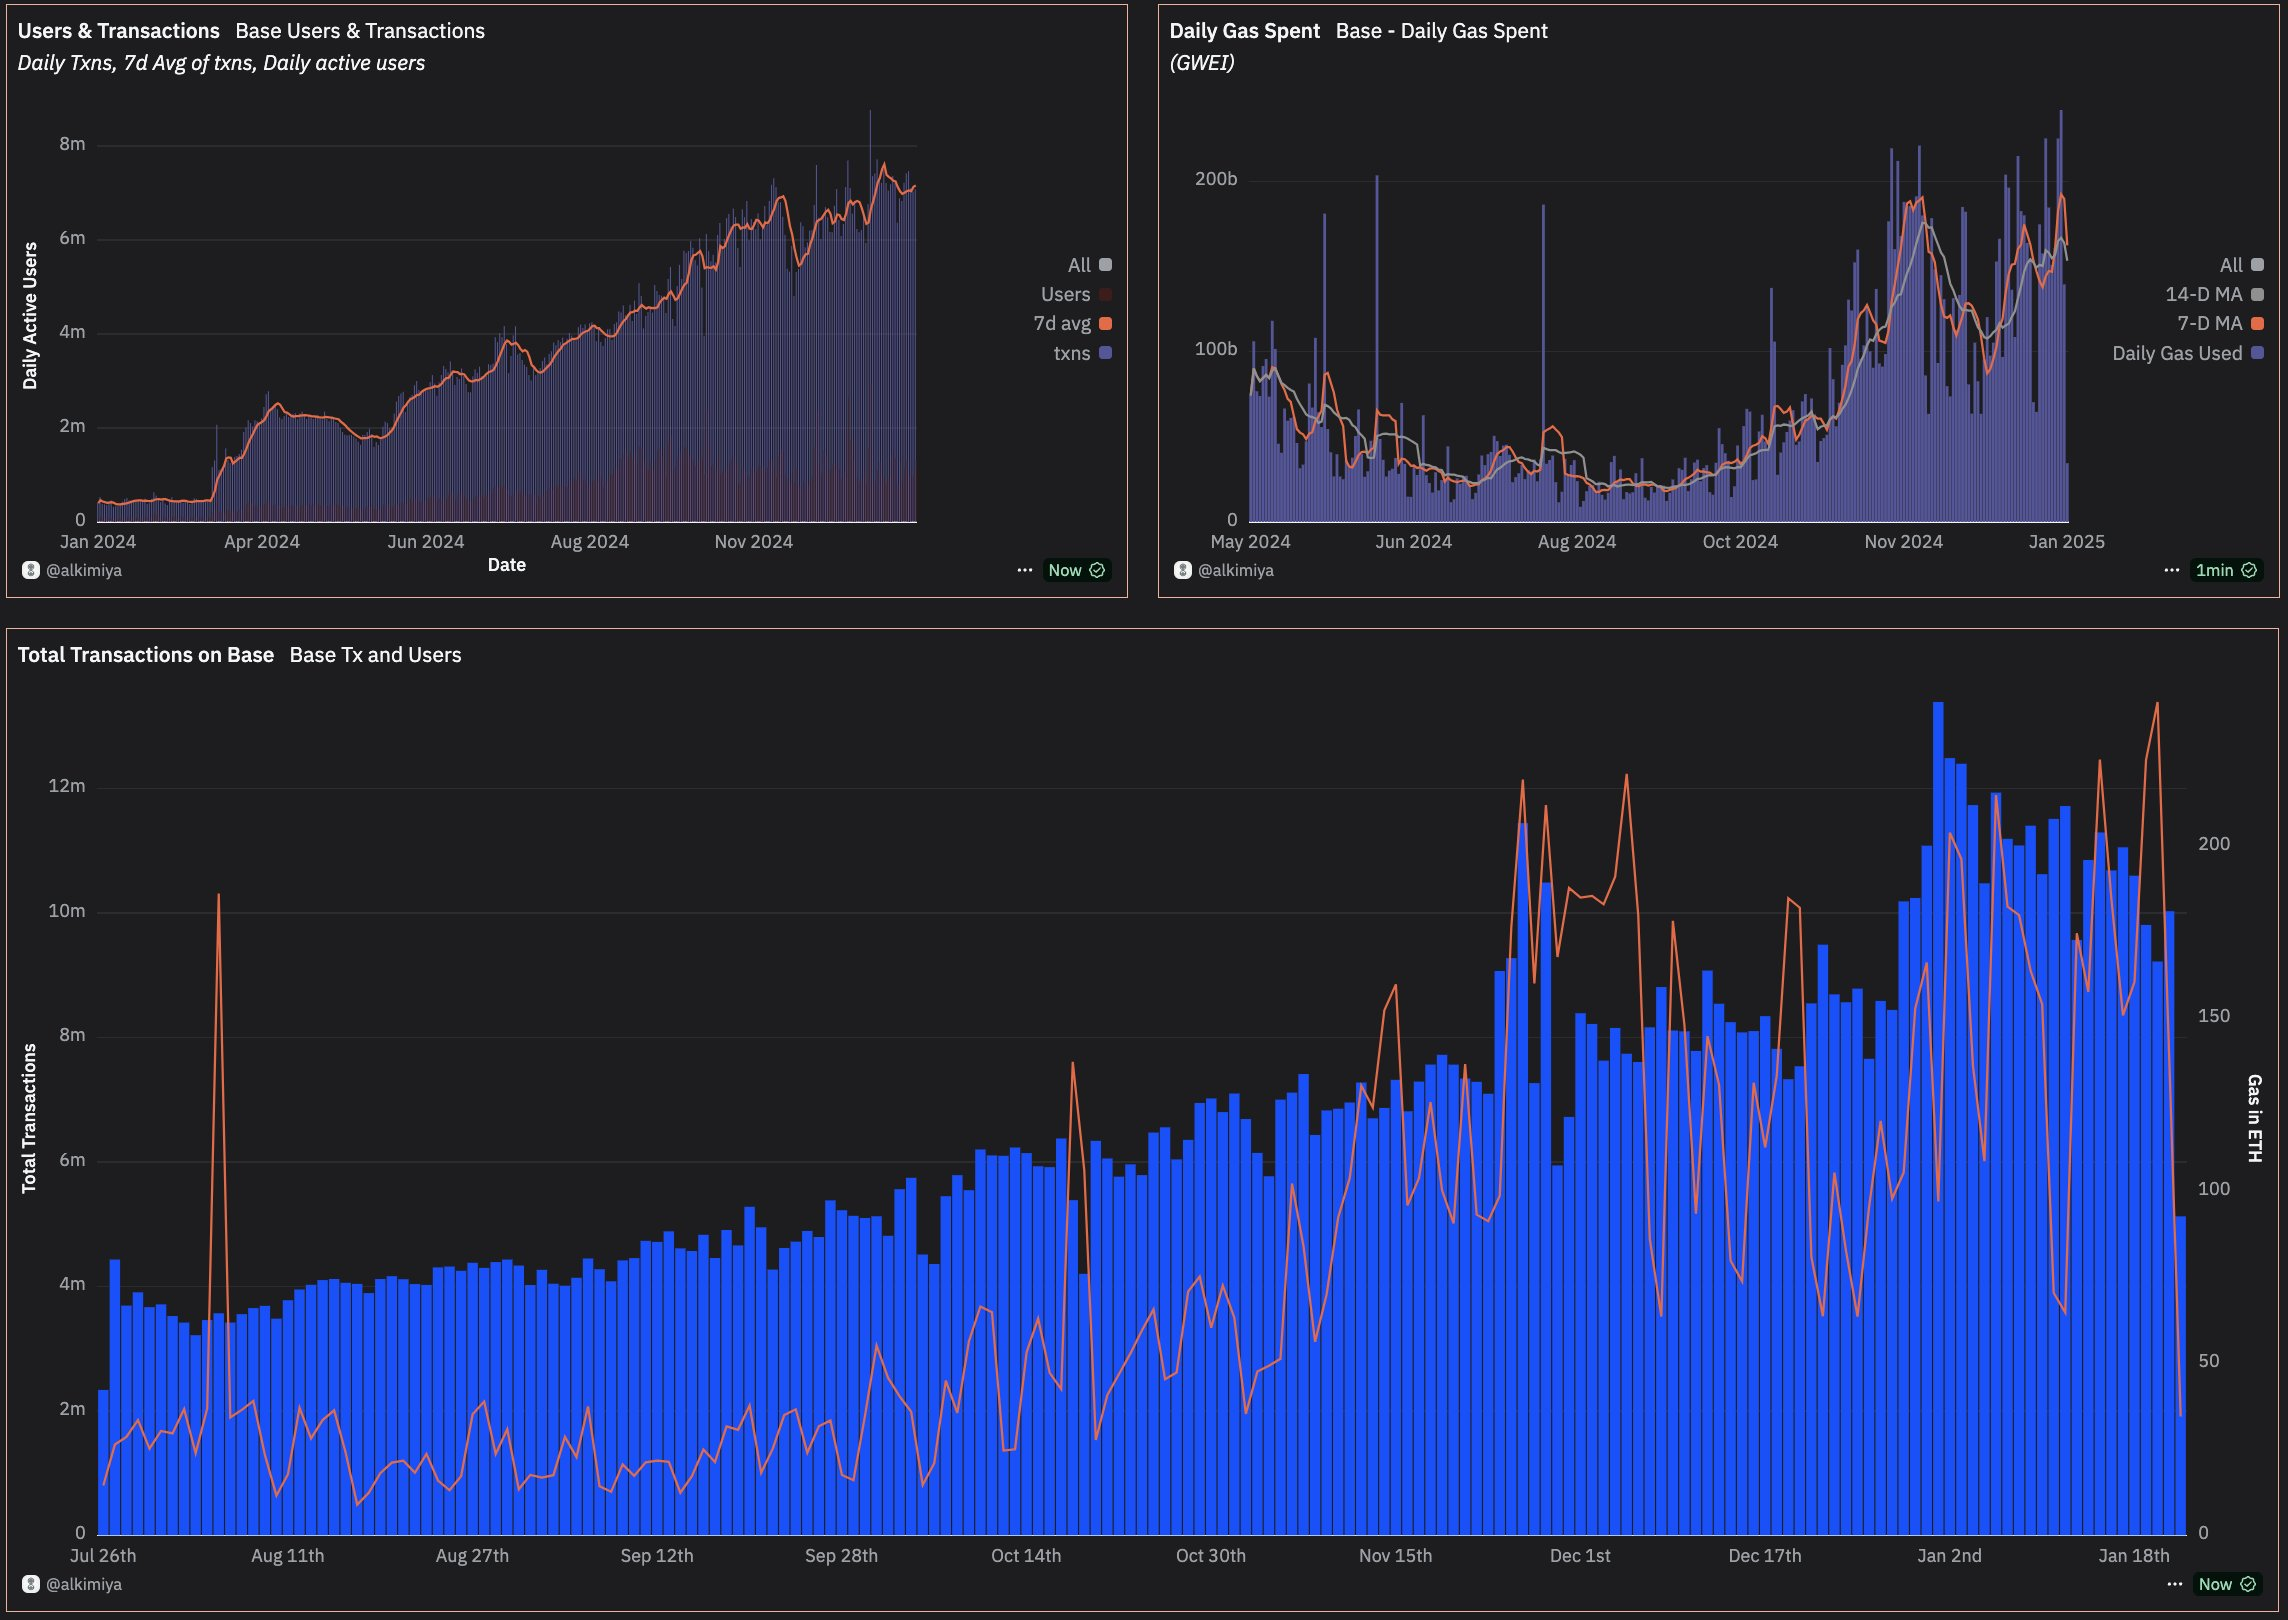
Source: Alkimiya's Base Gas Market, Dune
Weekly Financials
Drawing connections between the weekly metrics and onchain events can offer greater insight into the ecosystem’s ebb and flow.
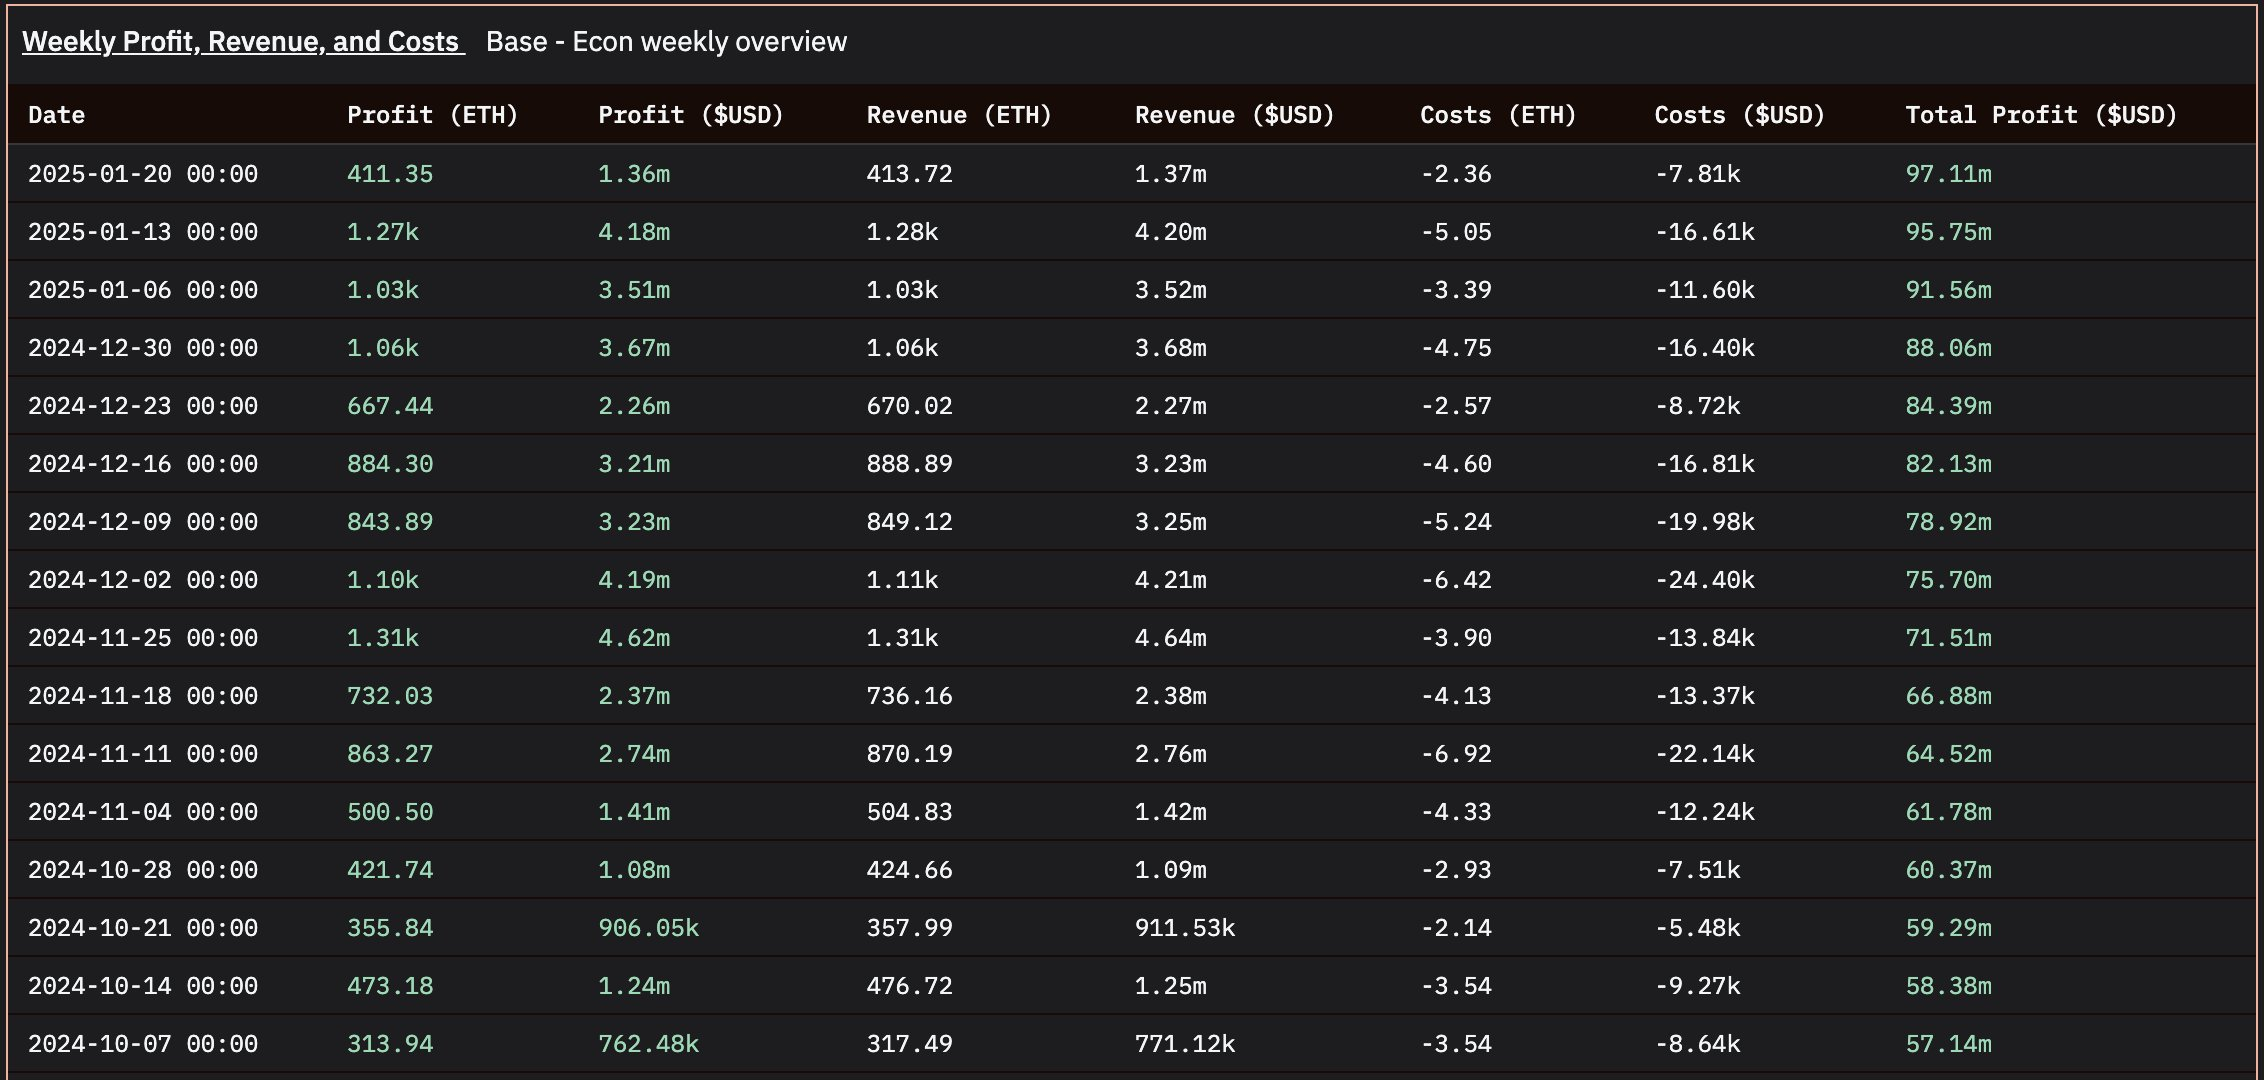
Source: Alkimiya's Base Gas Market, Dune
This dashboard deep dives into Base-related activities, and is a good pulse check on the ecosystem’s health.
User Metrics
The retention rate of users on Base can provide insight into what or who is driving the ecosystem’s growth.
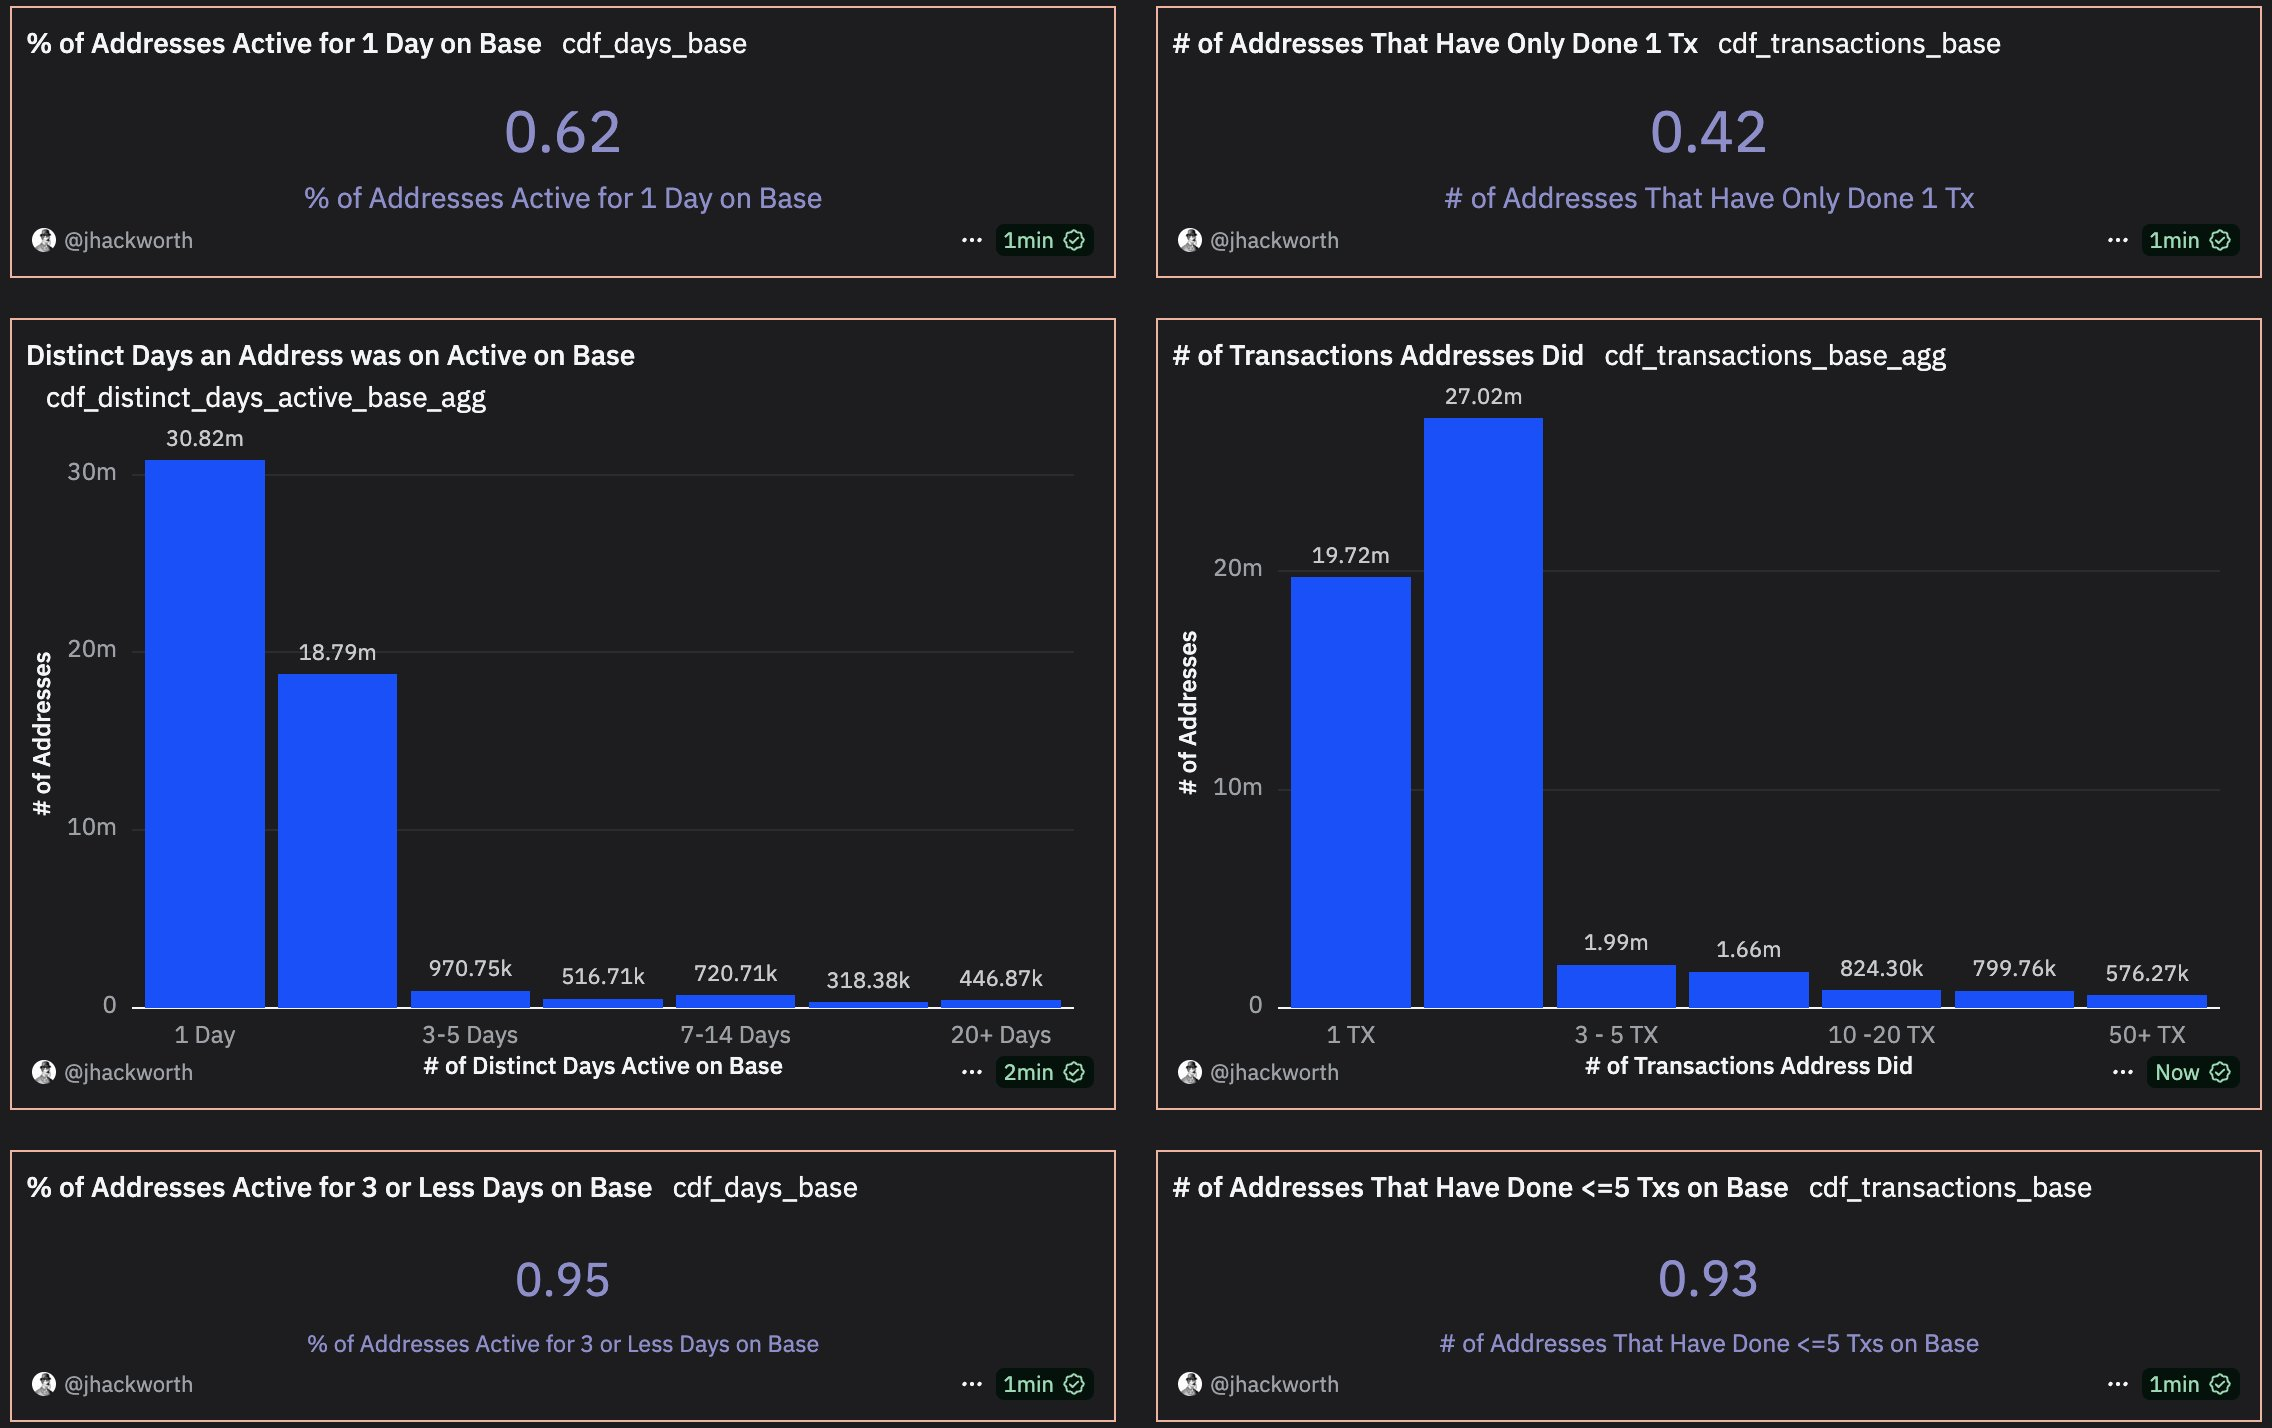
Source: jhackworth, Dune
Top Base Projects & Categories
A deeper dive into the categorical breakdown of tx fees, tx count, and active addresses can help to link Base’s weekly financials and onchain events more easily.
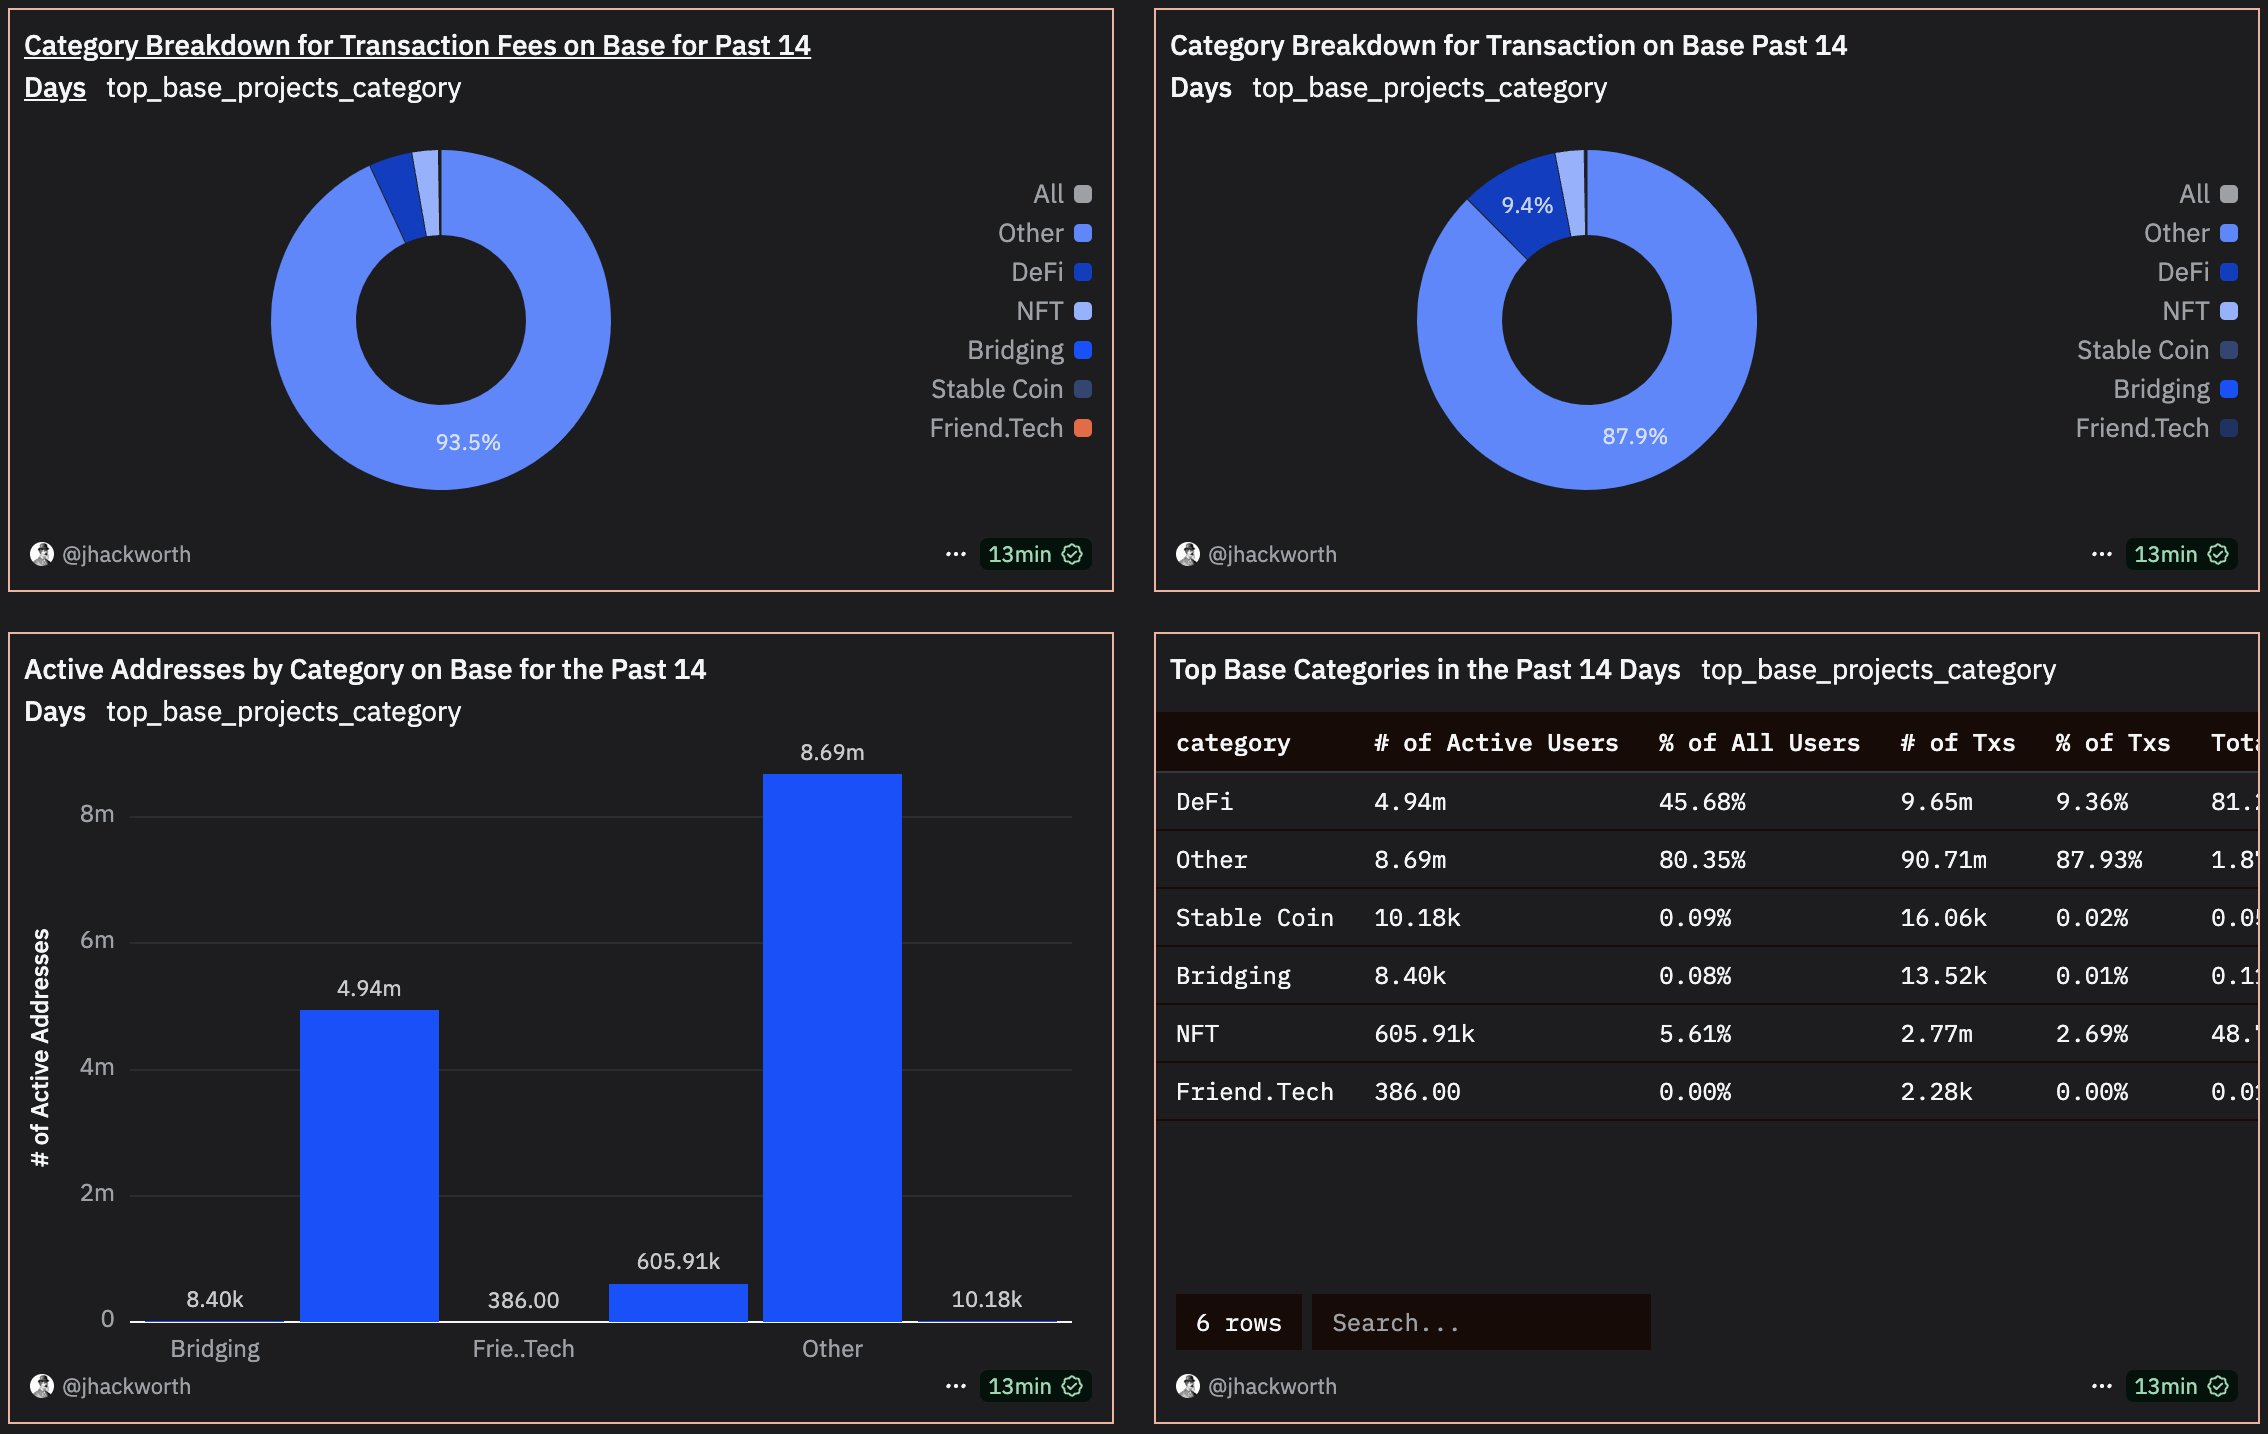
Source: jhackworth, Dune
NFT Activity
The majority of high-value transactions on Base are the result of well-telegraphed events, such as NFT mints.
A visualization of NFT activity can provide information to where the Total Gas Spent may land at the end of a pool.
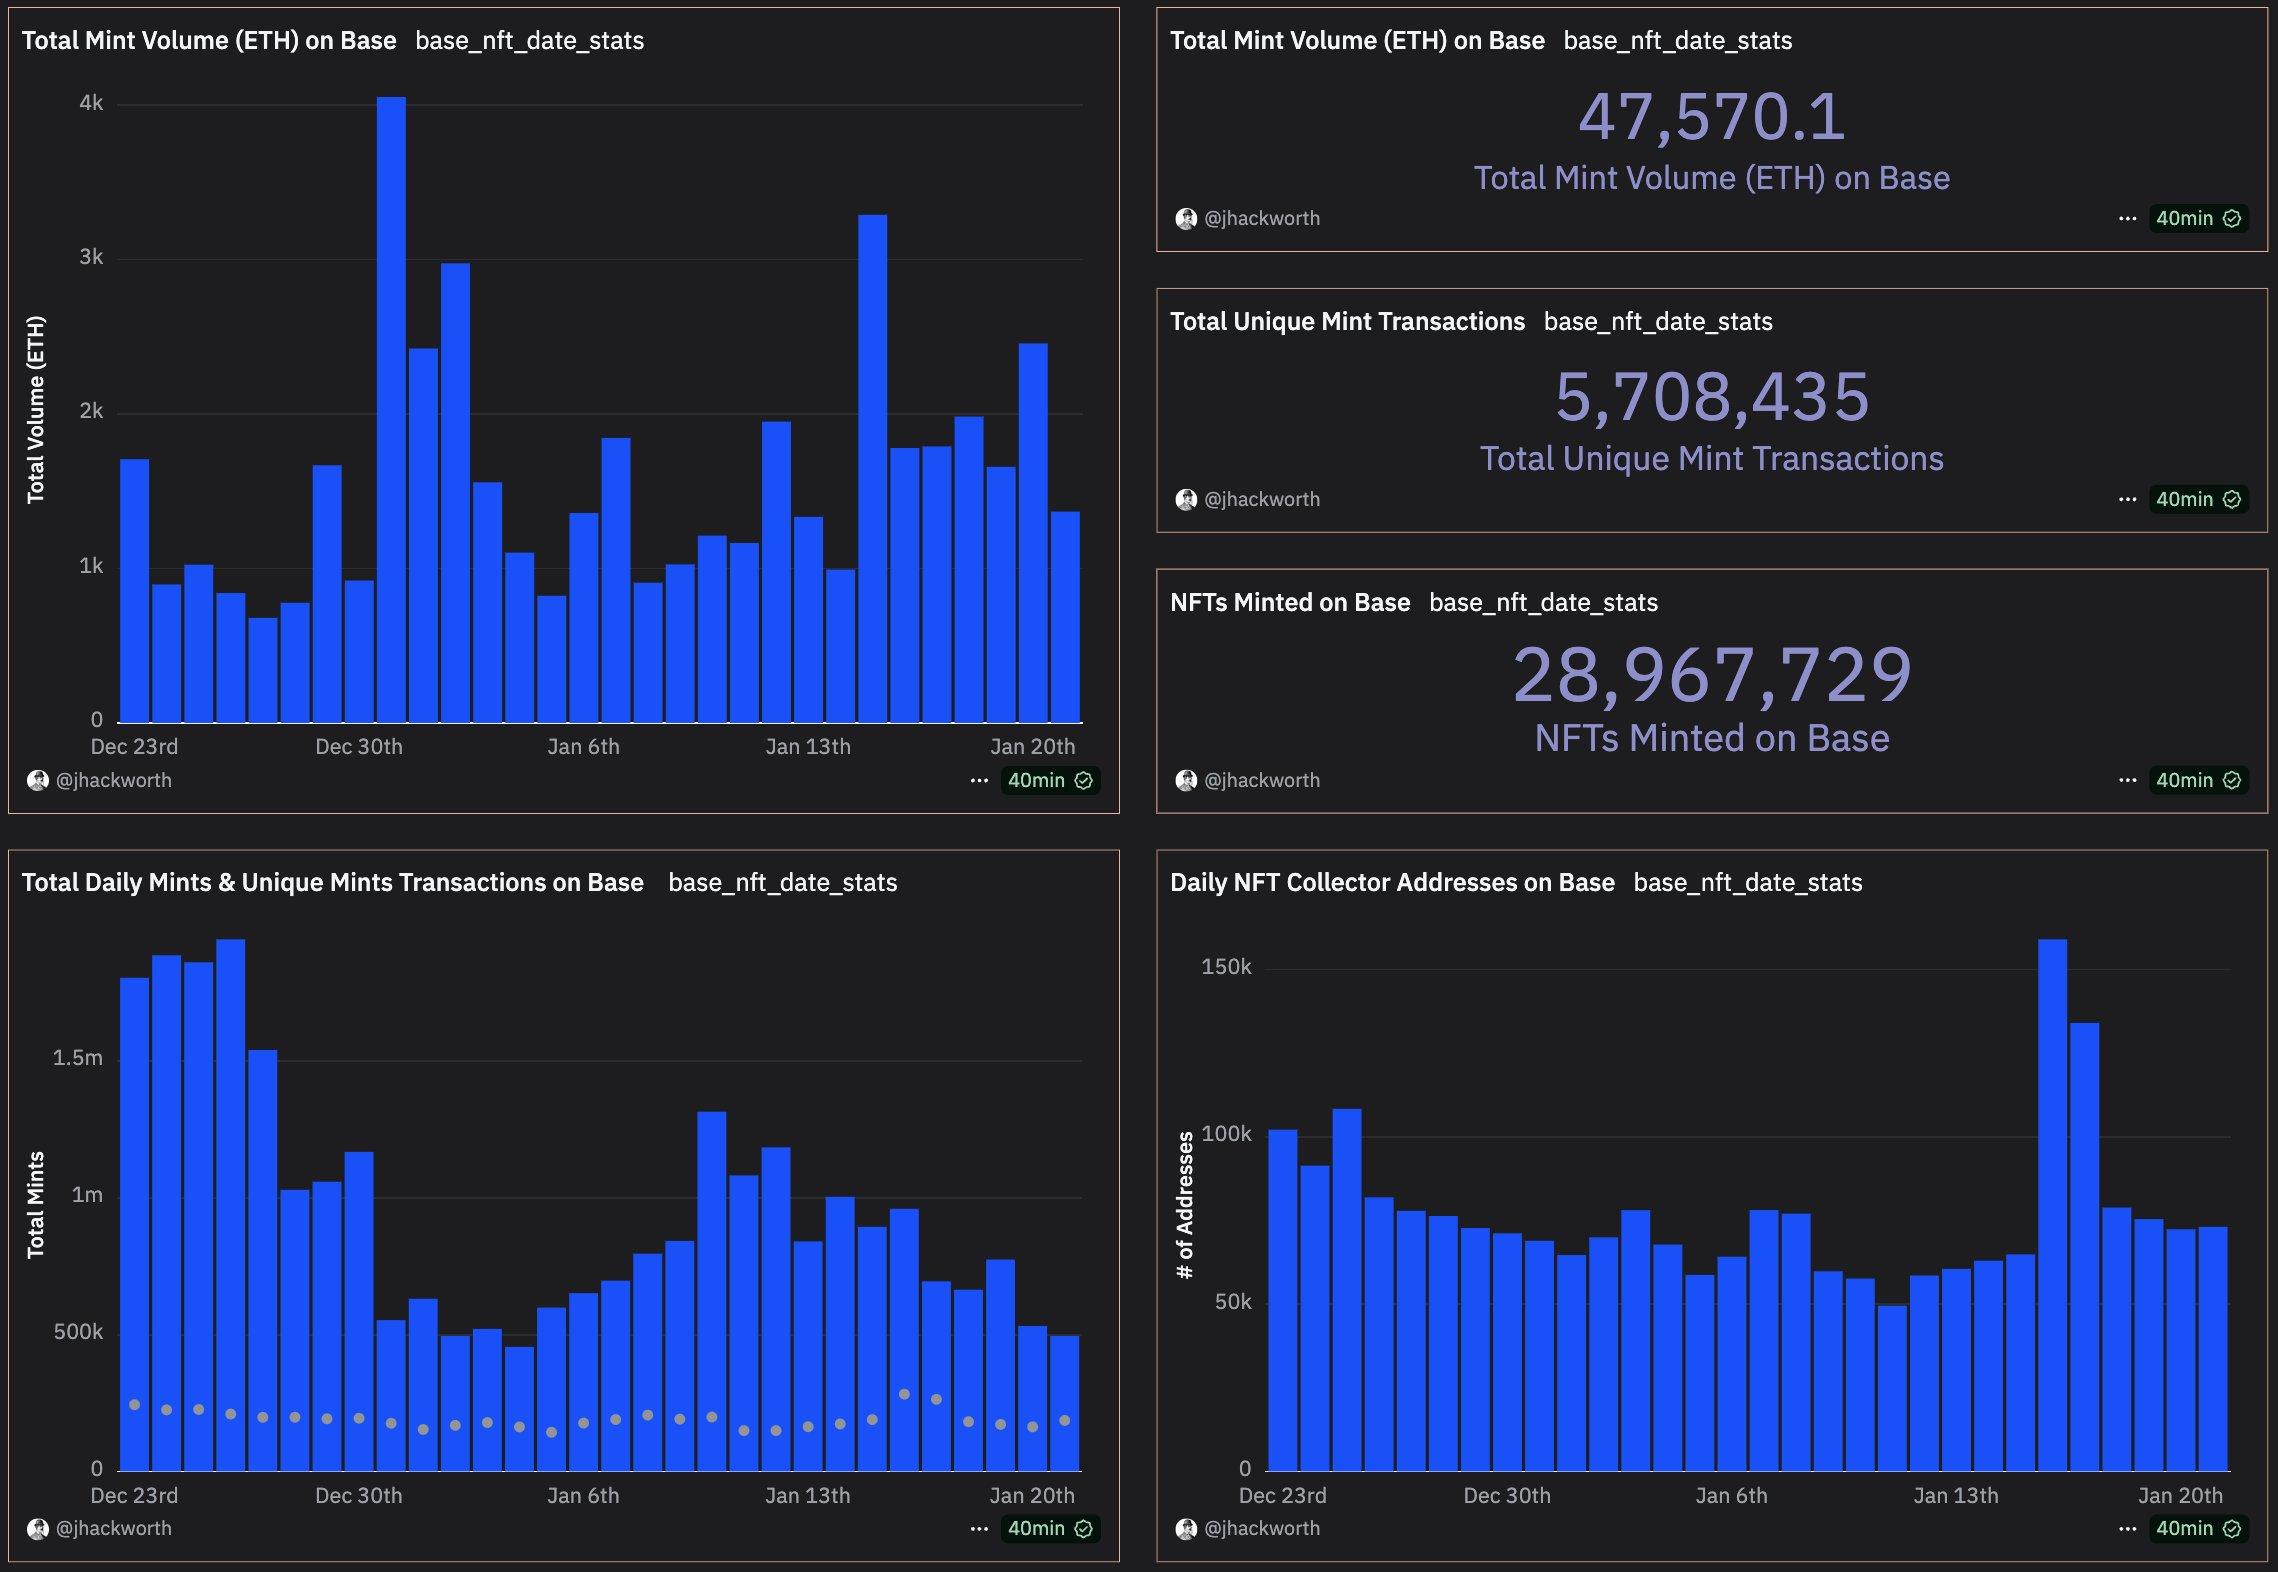
Source: jhackworth, Dune
This is a holistic dashboard on all things related to Base.
Onchain Economics
The onchain profit of L2s is the difference between
i) revenue from L2 gas fees collected; and
ii) expenses of posting transaction data & verification states onto Ethereum
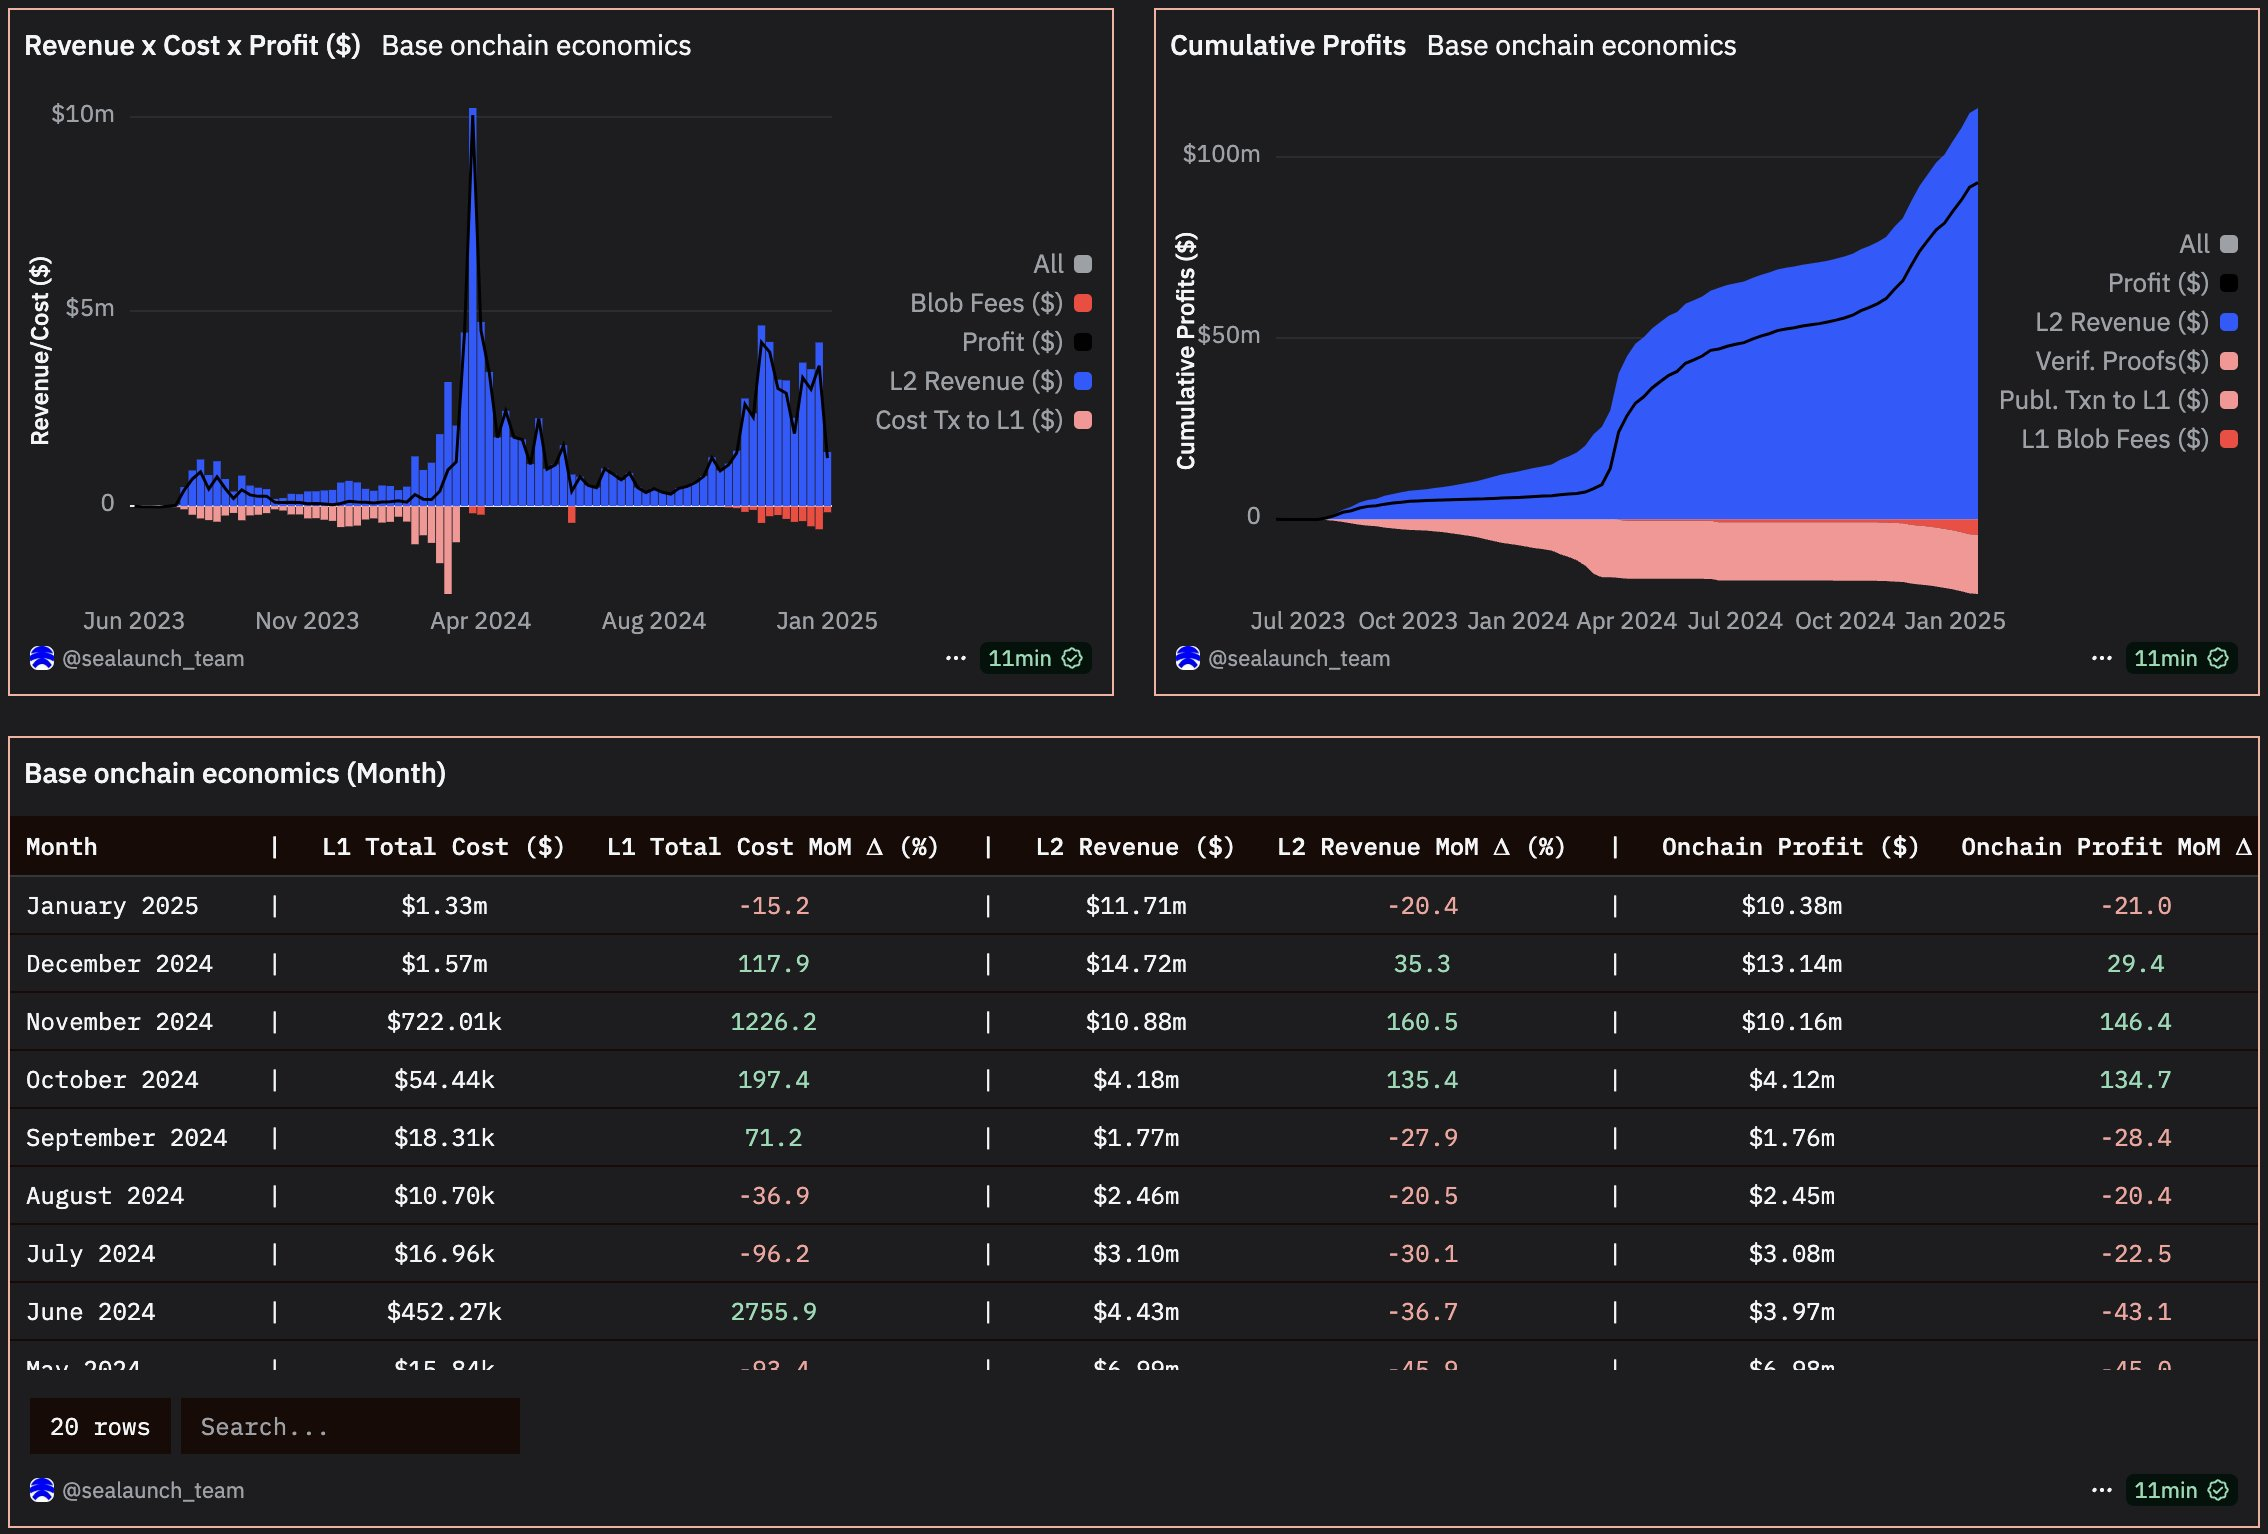
Source: Sealaunch, Dune
DEX Activity
For a more granular analysis, check out their other dashboard: DEX metrics on Base.
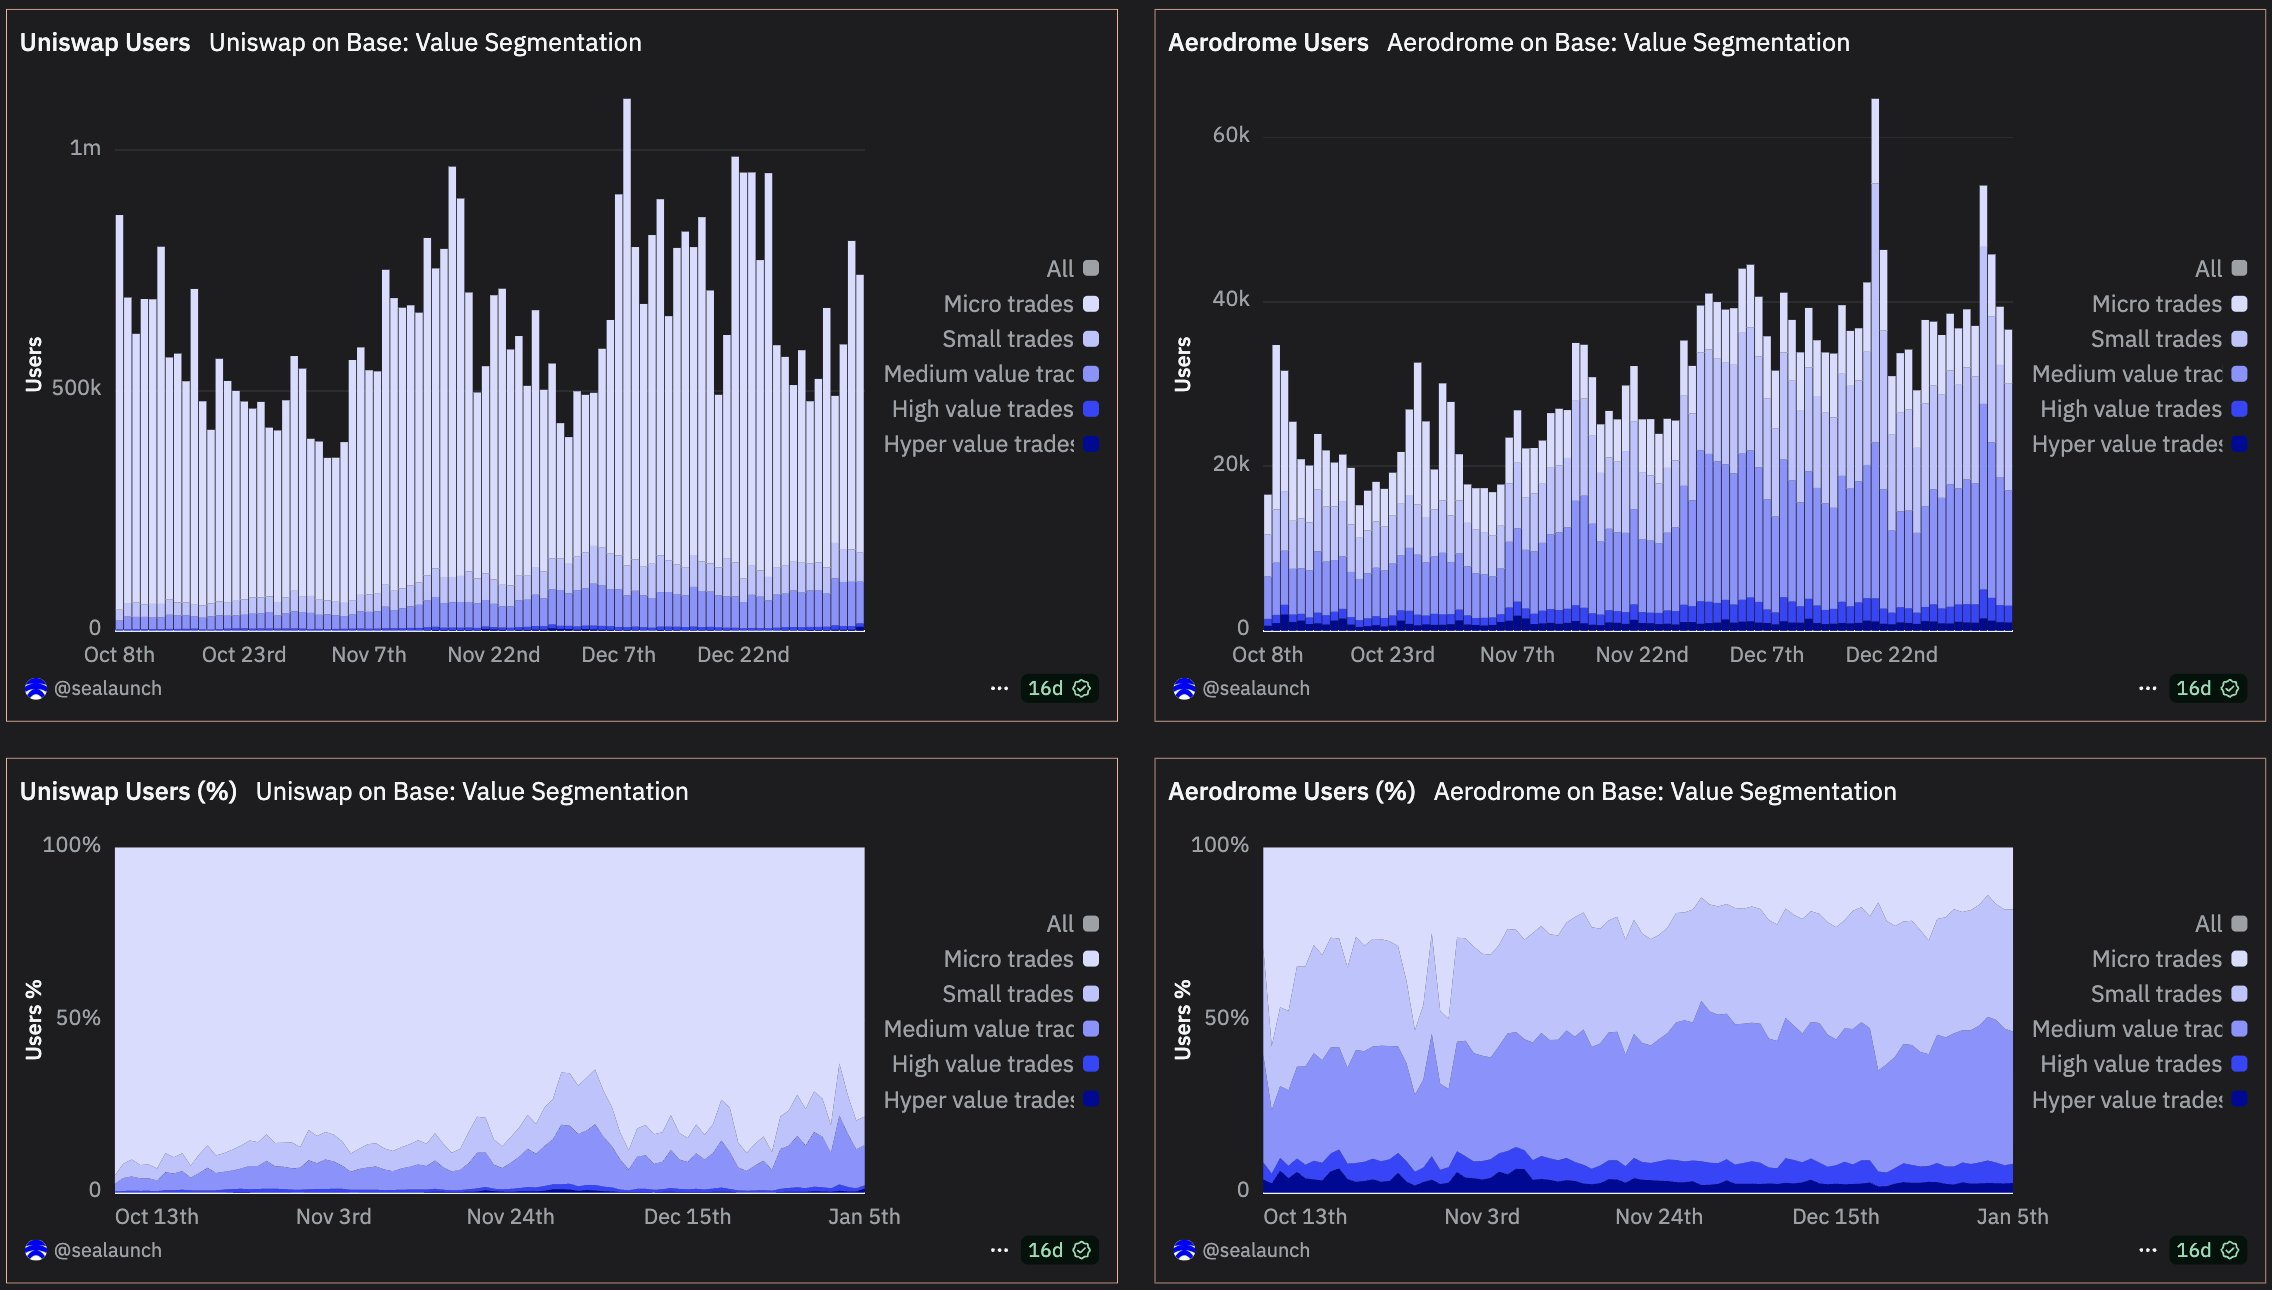
Source: Sealaunch, Dune
Focused on research and data, Blockworks Research has crafted a really good dashboard for all things Base. If you enjoy diving deep into the nitty gritty, this dashboard is perfect for you.
Financials
Base’s financials are fully available, including a quarterly breakdown of revenue, expenses, and profit.
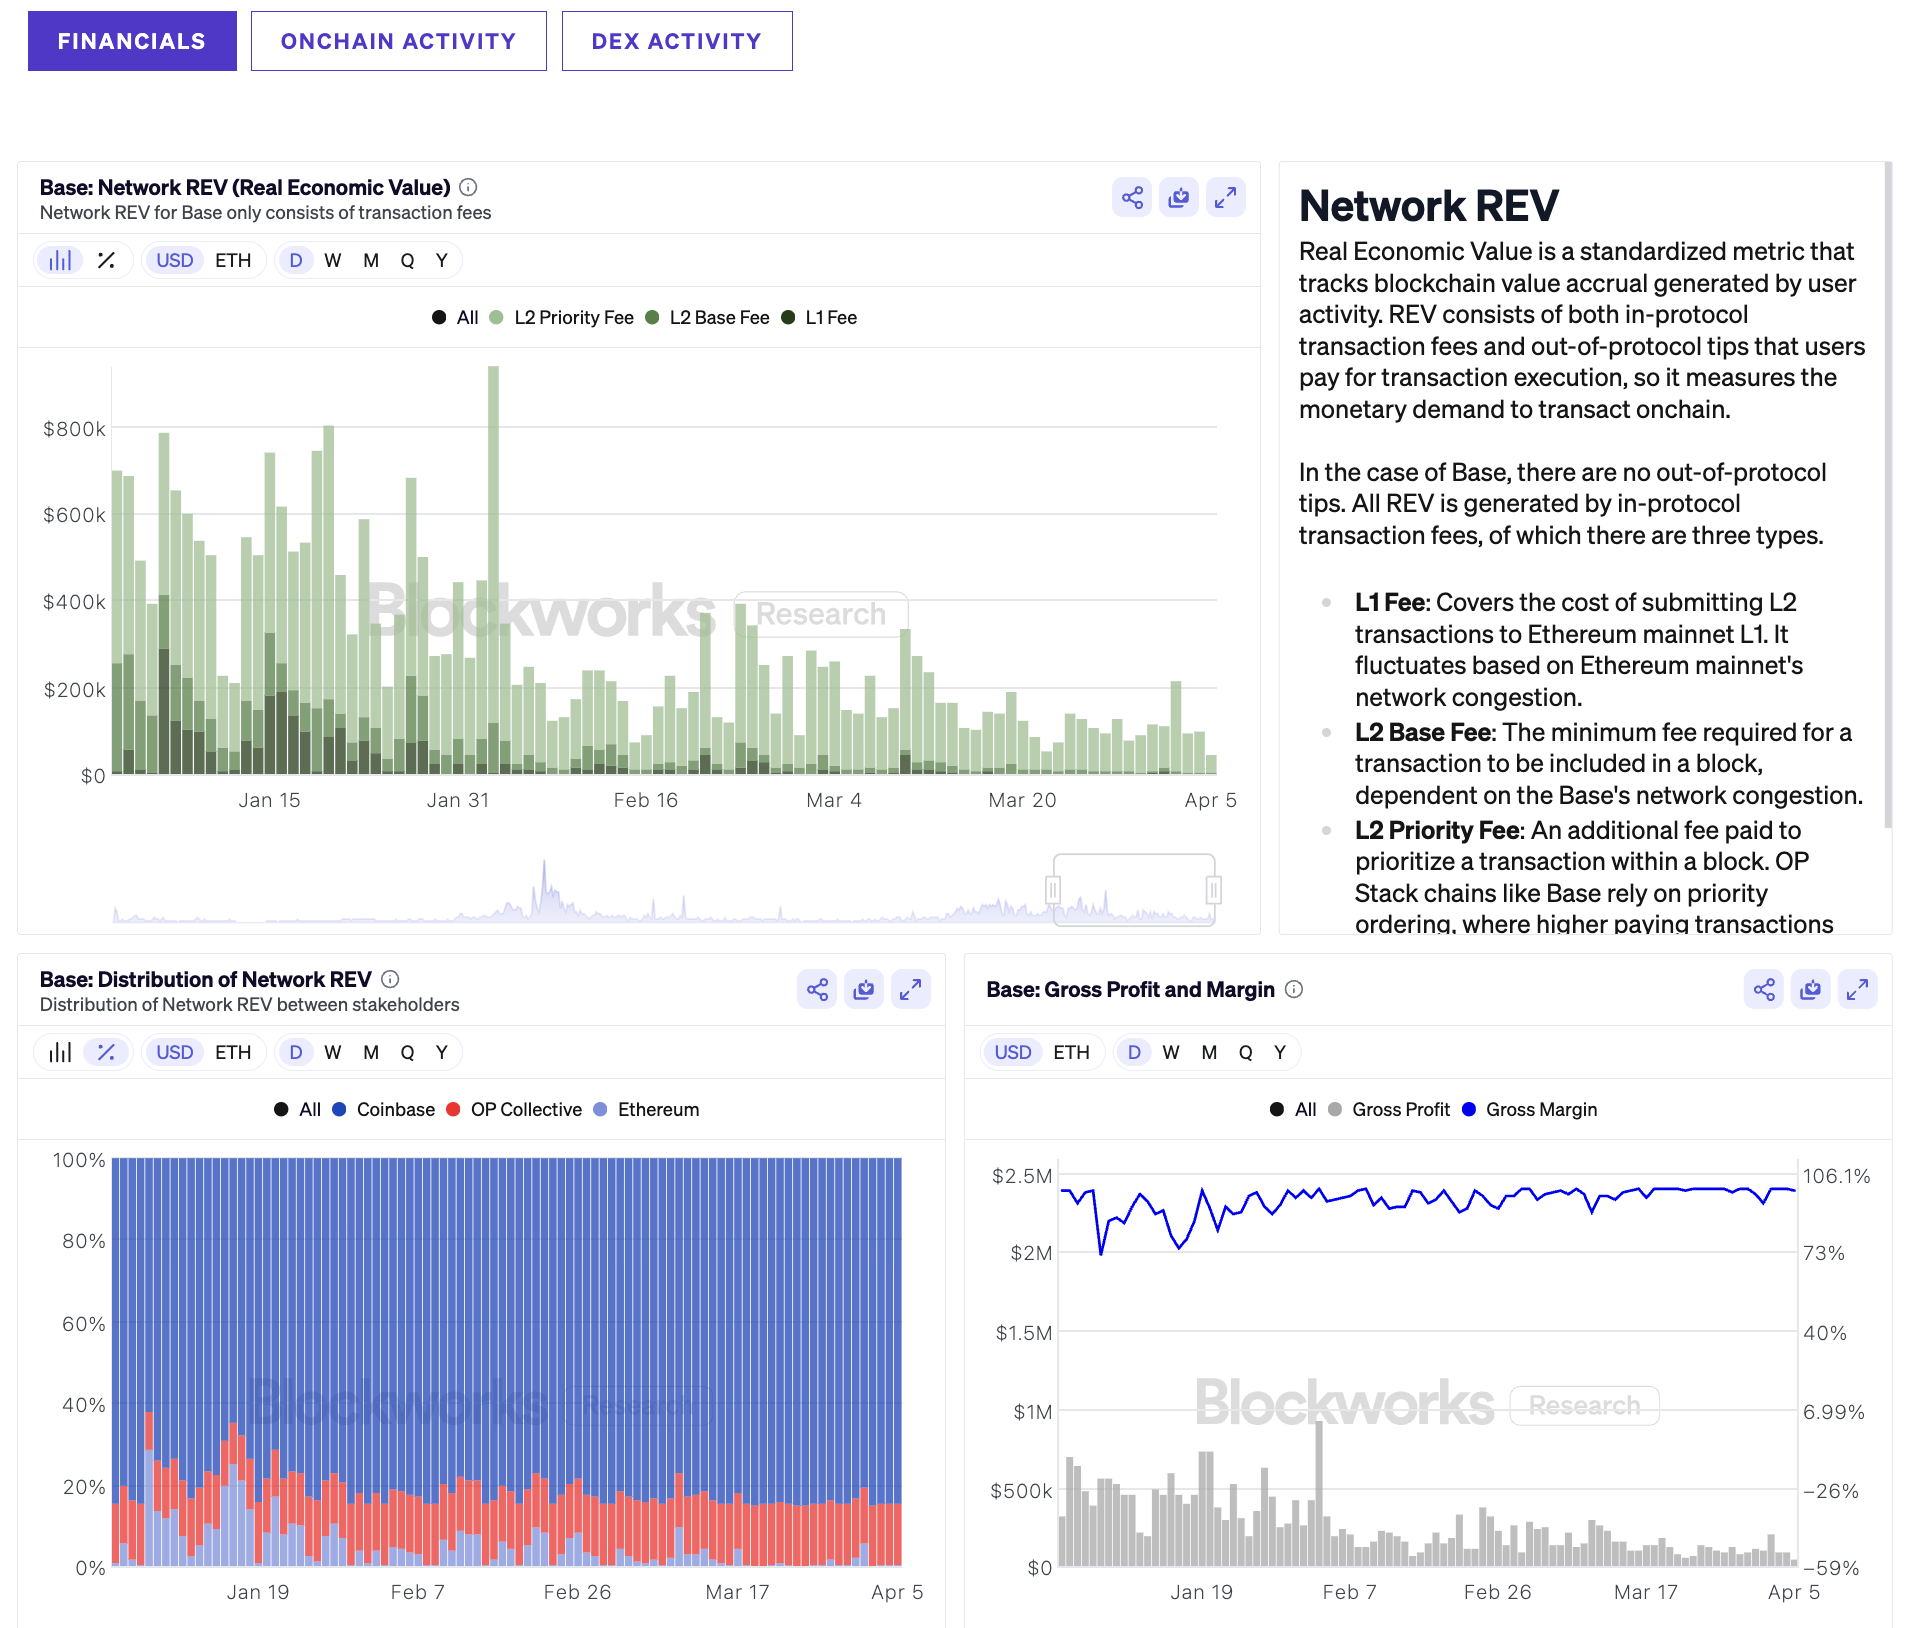
Source: Base, Blockworks Research
Onchain Activity
From the number of transactions to the type of tokens used to pay for transaction fees, you can find a full breakdown of Base’s onchain activity here.
This includes metrics that you never thought would be insightful or useful to analyze.
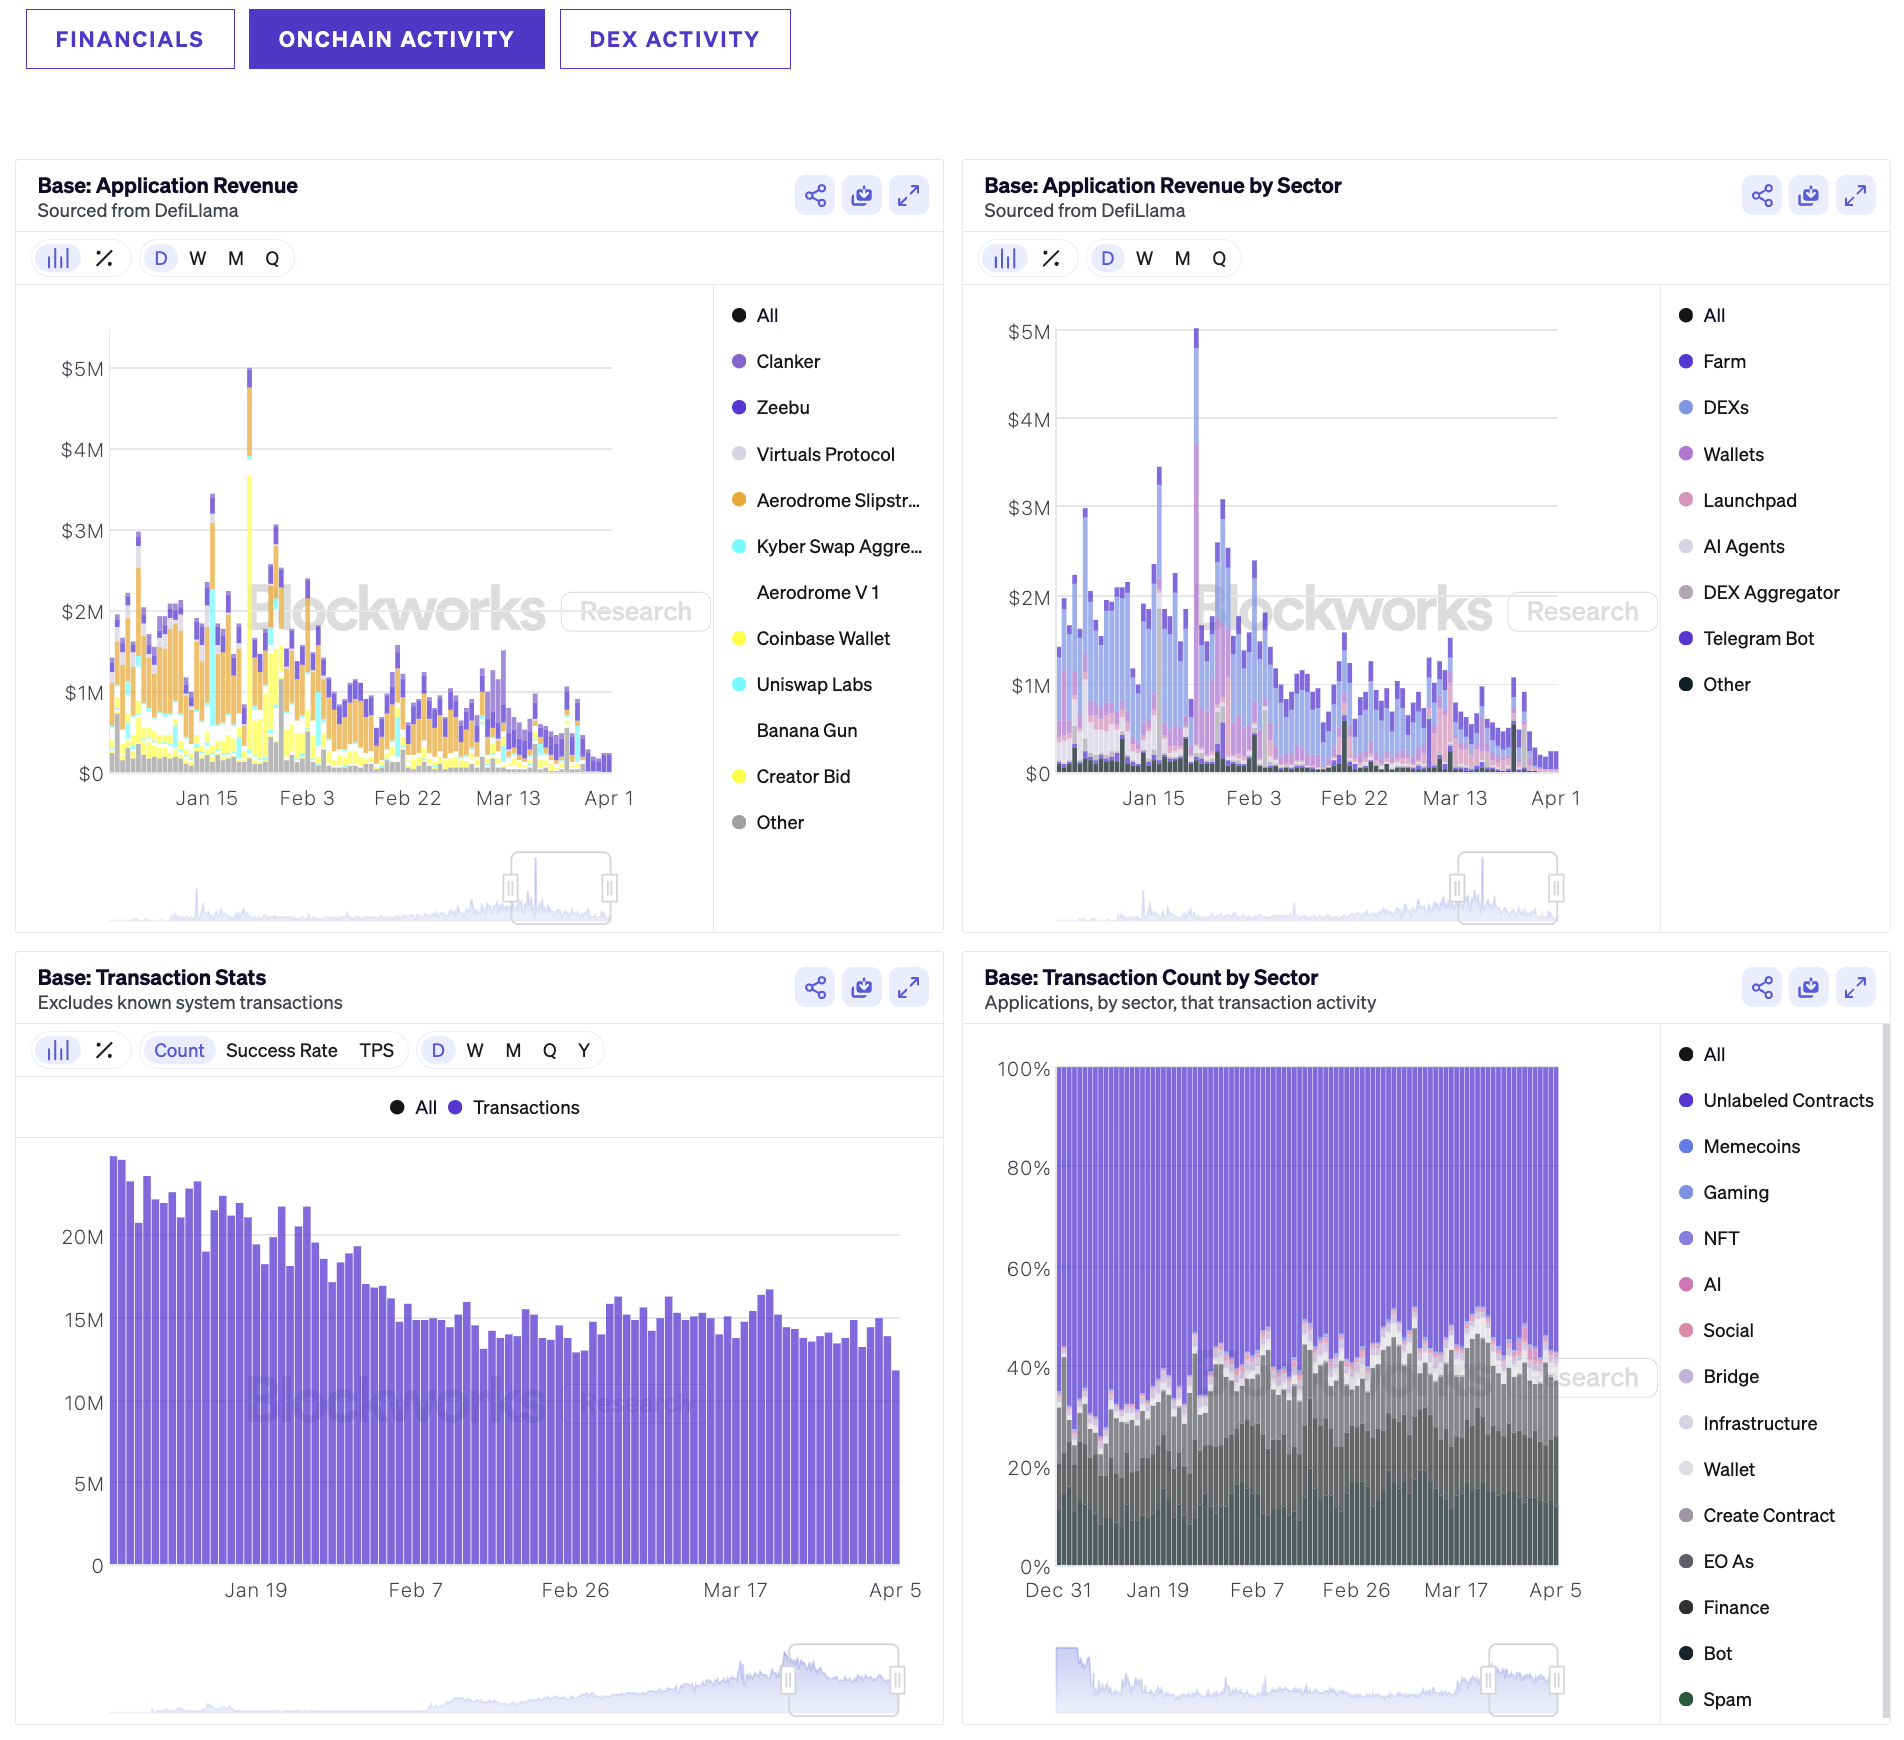
Source: Base, Blockworks Research
DEX Activity
This view goes as far as analyzing memecoin activity and AI agent token activity. These narratives are very active at the moment and such analyses are highly informative, especially to degens.
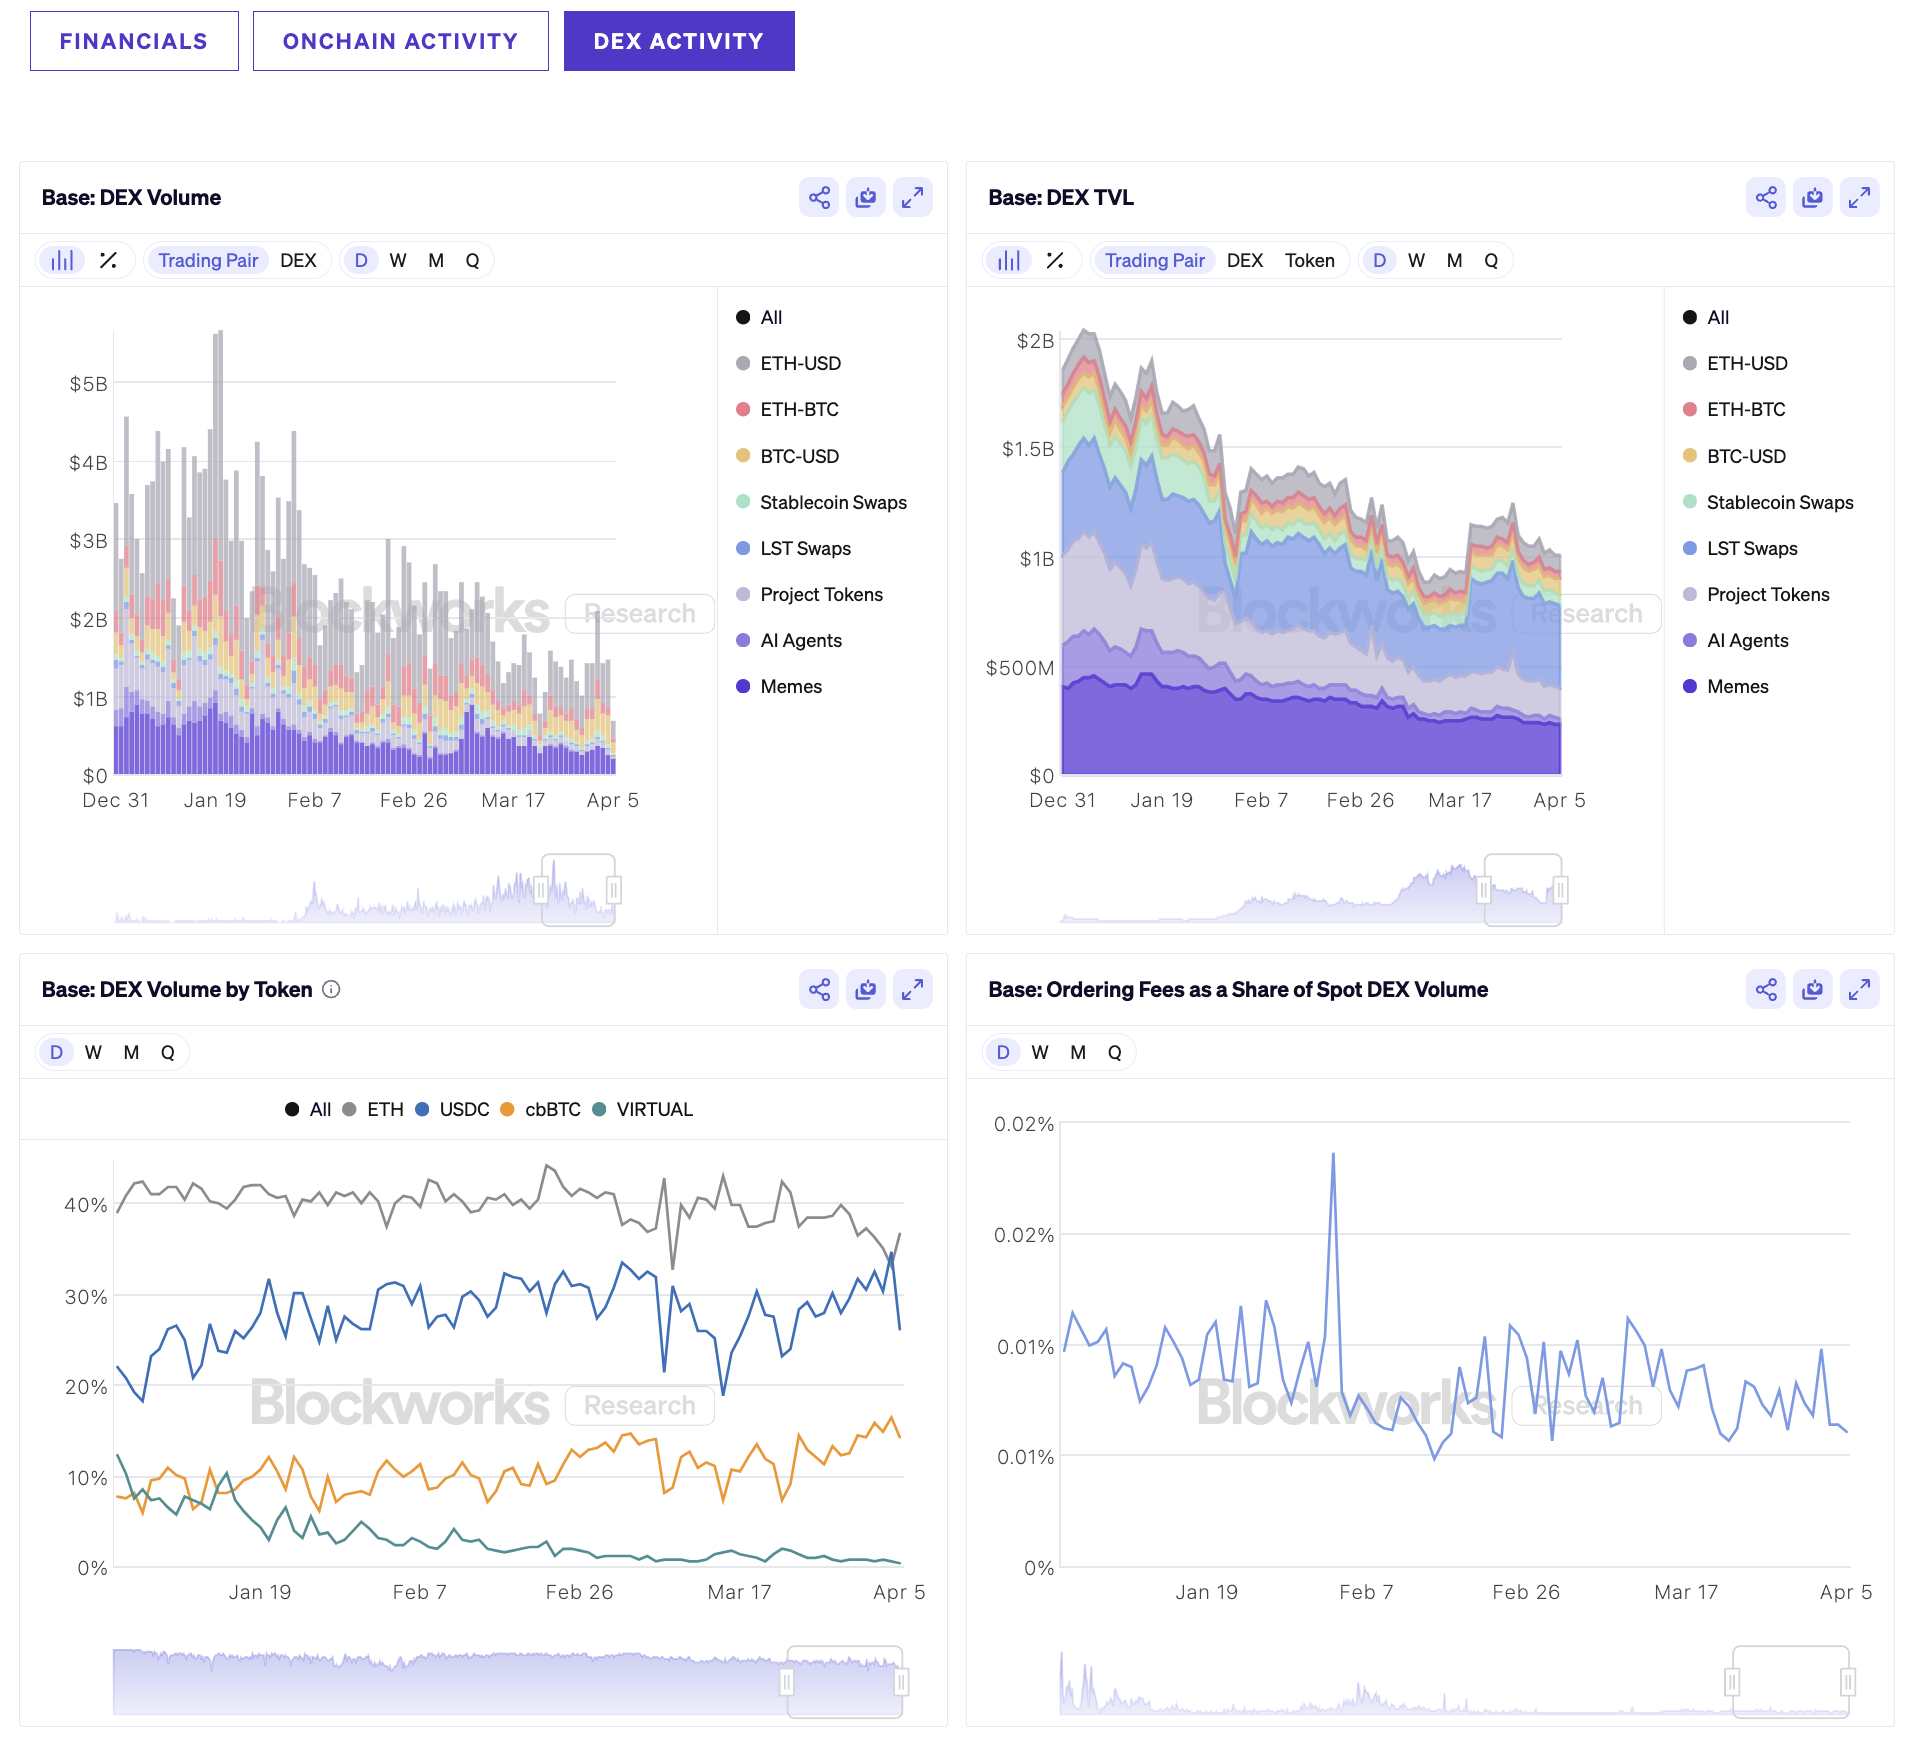
Source: Base, Blockworks Research
Token Terminal works like Dune, except that you don’t need to learn how to code. Finding and comparing metrics of ecosystems are easy via their platform.
Sometimes, they create their own dashboards like the one for Base’s GDP.
This dashboard fully focuses on the fees (aka revenue) of Base via its applications.
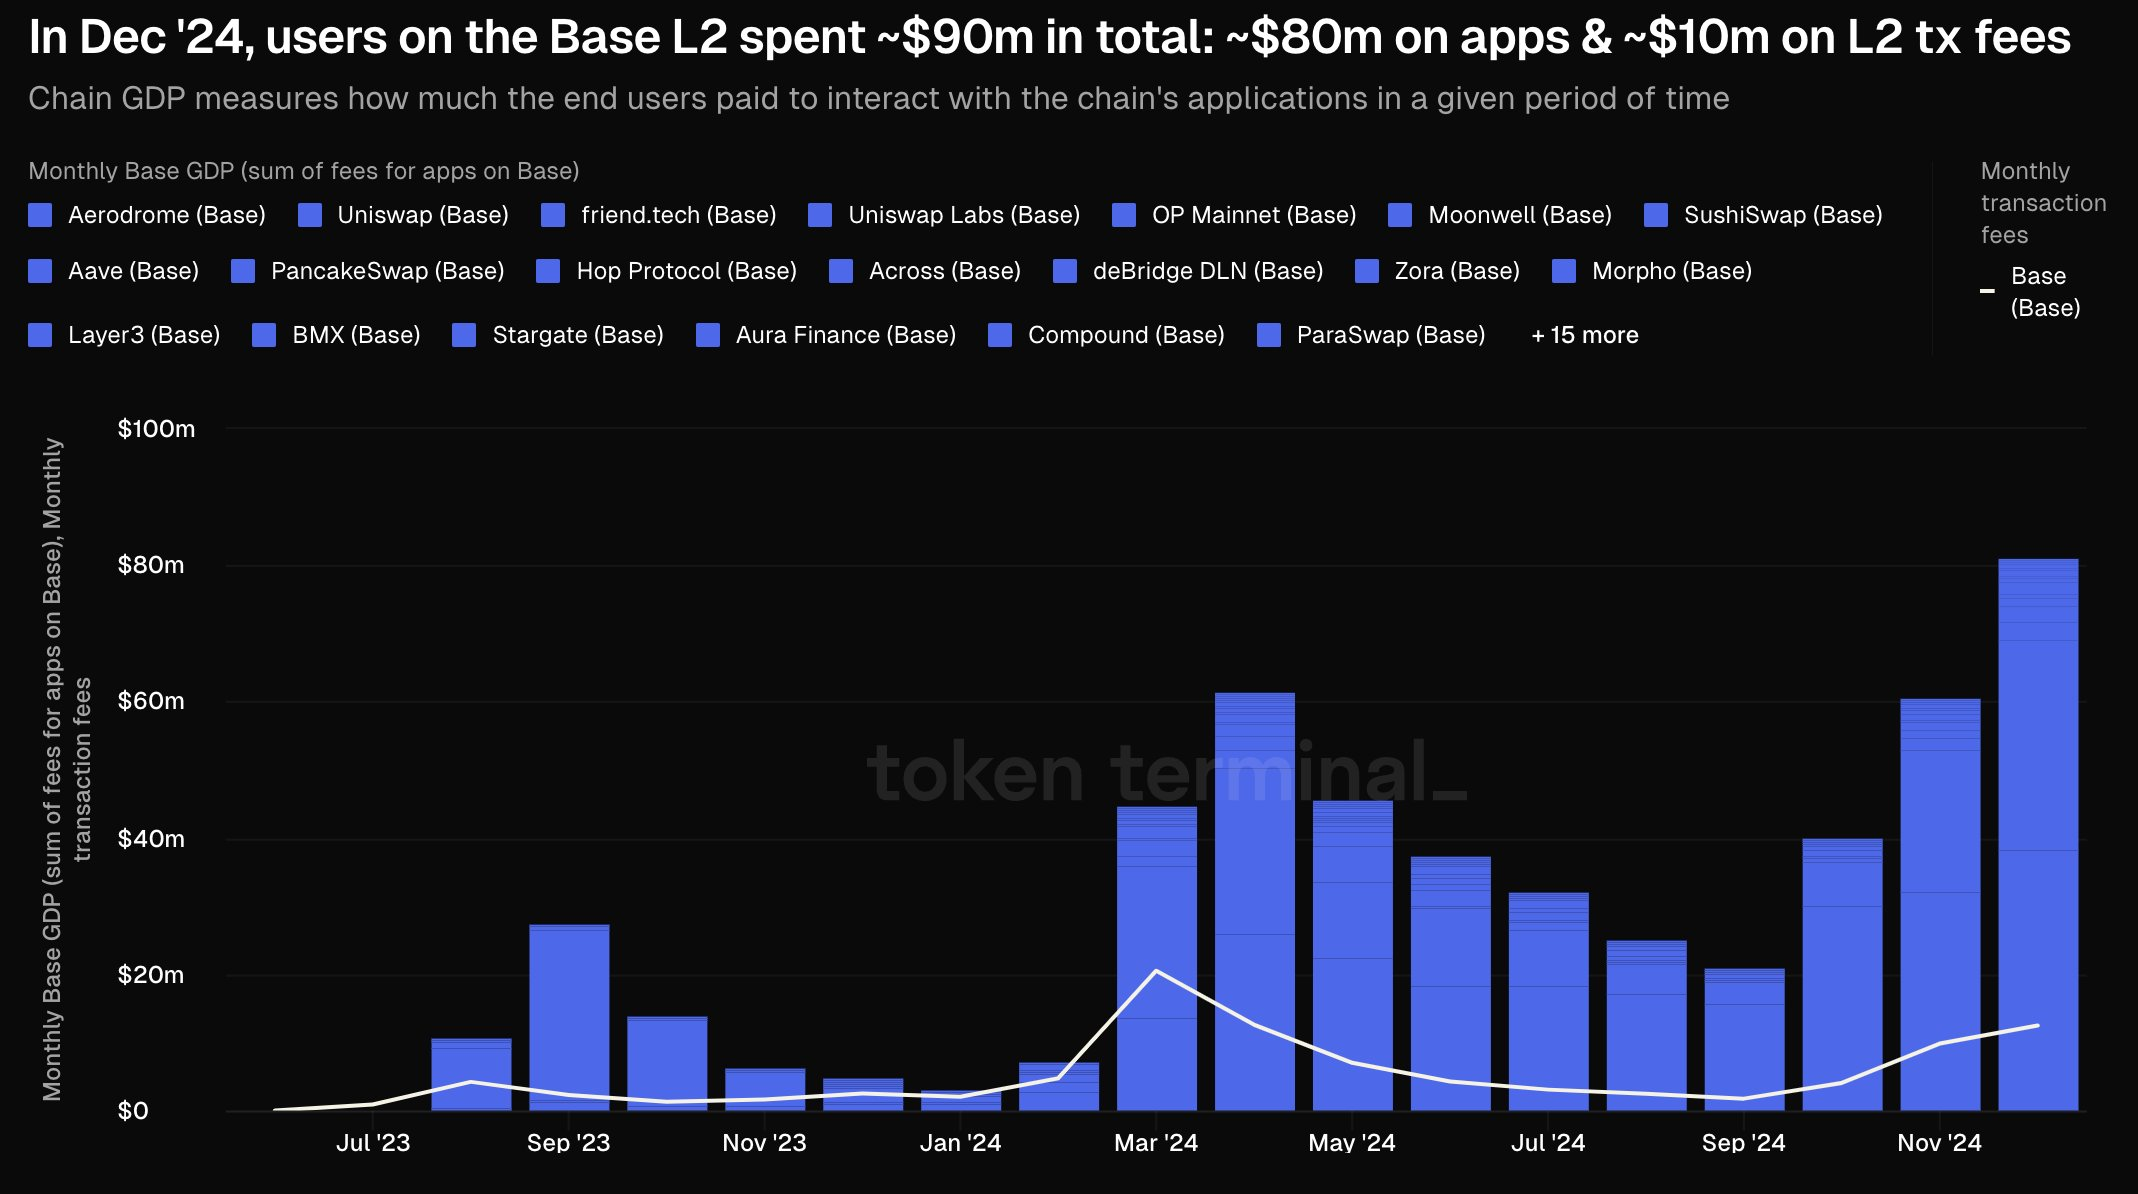
Source: Base L2 GDP, Token Terminal
There are many platforms available to research on-chain activities, but it is important to choose those that best fit your needs.
Updated over 1 year ago